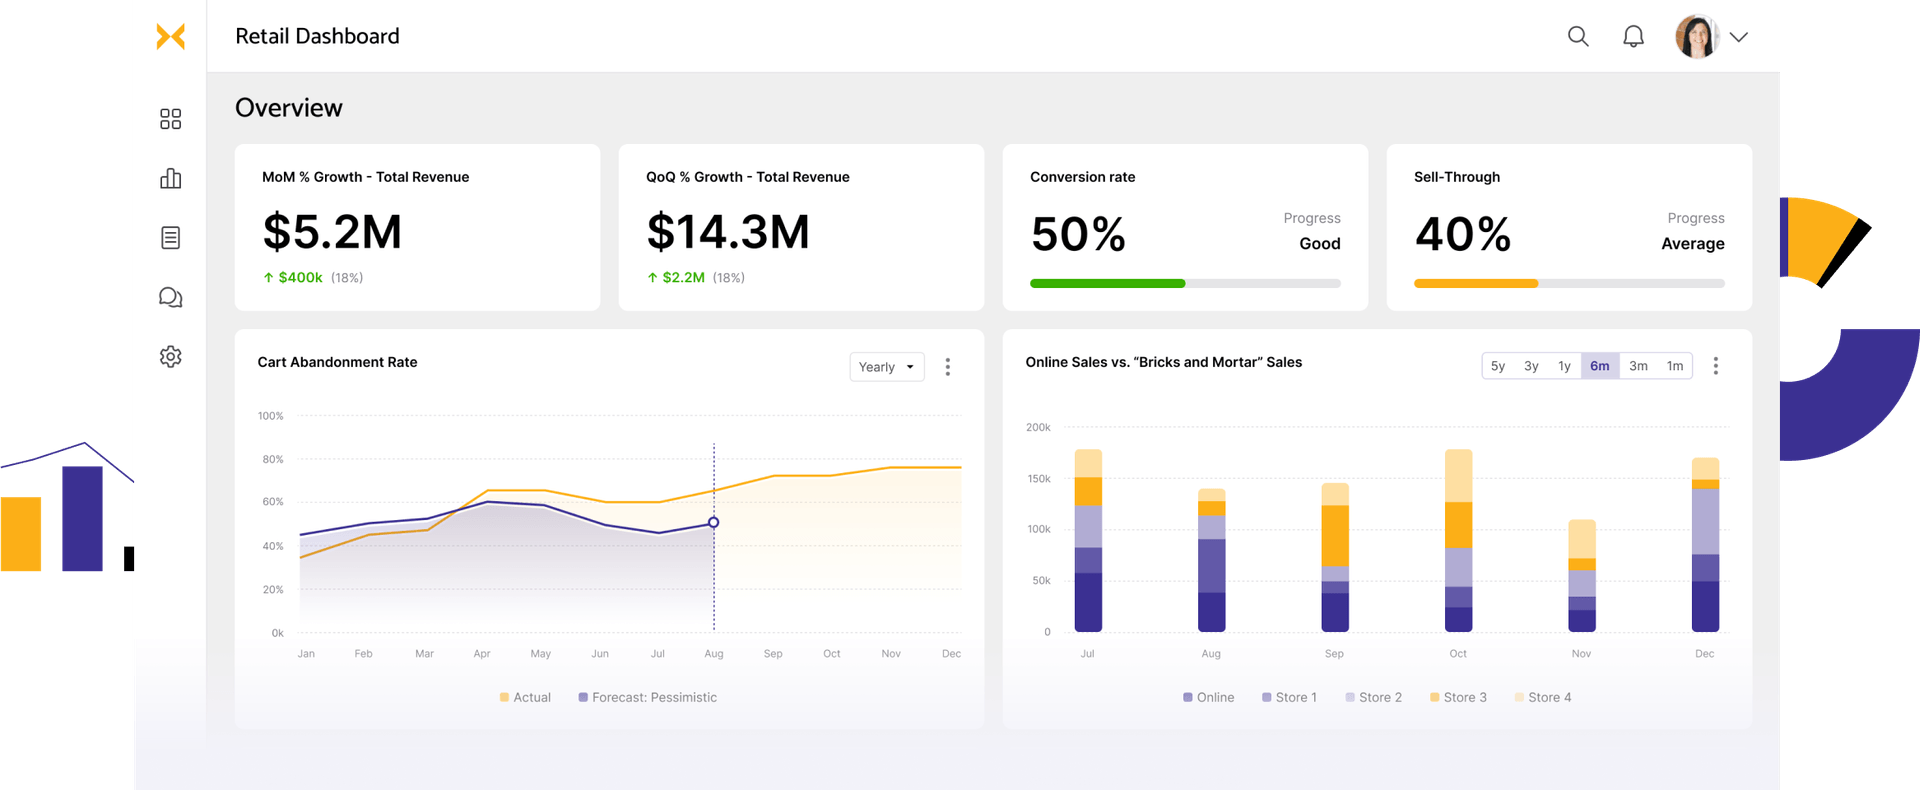

One-stop shop for all important retail metrics
Dynamic market demands, Omni-channel touchpoints, high employee turnover, customer retention, cut-throat competitions - too many tasks to juggle for retailers. Use our dashboard template exclusively built for retailers and stack metrics nicely on one display.
Make reporting fun with your customization
14-days no-commitment POC. Schedule a call to initiate yours.
Build my dashboard
It’s all about details. This is what you'll find on your retail dashboard.


Sales trend
Follow the curve to see where growth takes you to.
The top best-sellers and their sales trends over a time is displayed here. Let the curve show you how product sales dip and peak, unwrapping insights you have never seen before.
Net sales analysis
Trace where your net sales come from
This intuitive section is all about the major contributors of your net sales - the states, locations, products, and everything else. Trace back the journey of your revenue from global level to product level in a few moves.
Data-driven deals
Plan your offers, giveaways, BOGOs, and other sales promotions.
Clear inventories without compromising on profits. Optimize your promotional campaigns with clever insights. Don’t just make your customers feel smart. Sell smart.
Geography-wide sales
Catch on each division’s performance
Become the kid in the candy store. Use our engaging visual cues to consume and compare state-wide sales data. Expand it and see how each state is catching up.
Customer feedback
Count stars that matter
One star or five ratings - trace back to where it comes from, what made them say so, and how to fix them.
Types of dashboards for your different business needs
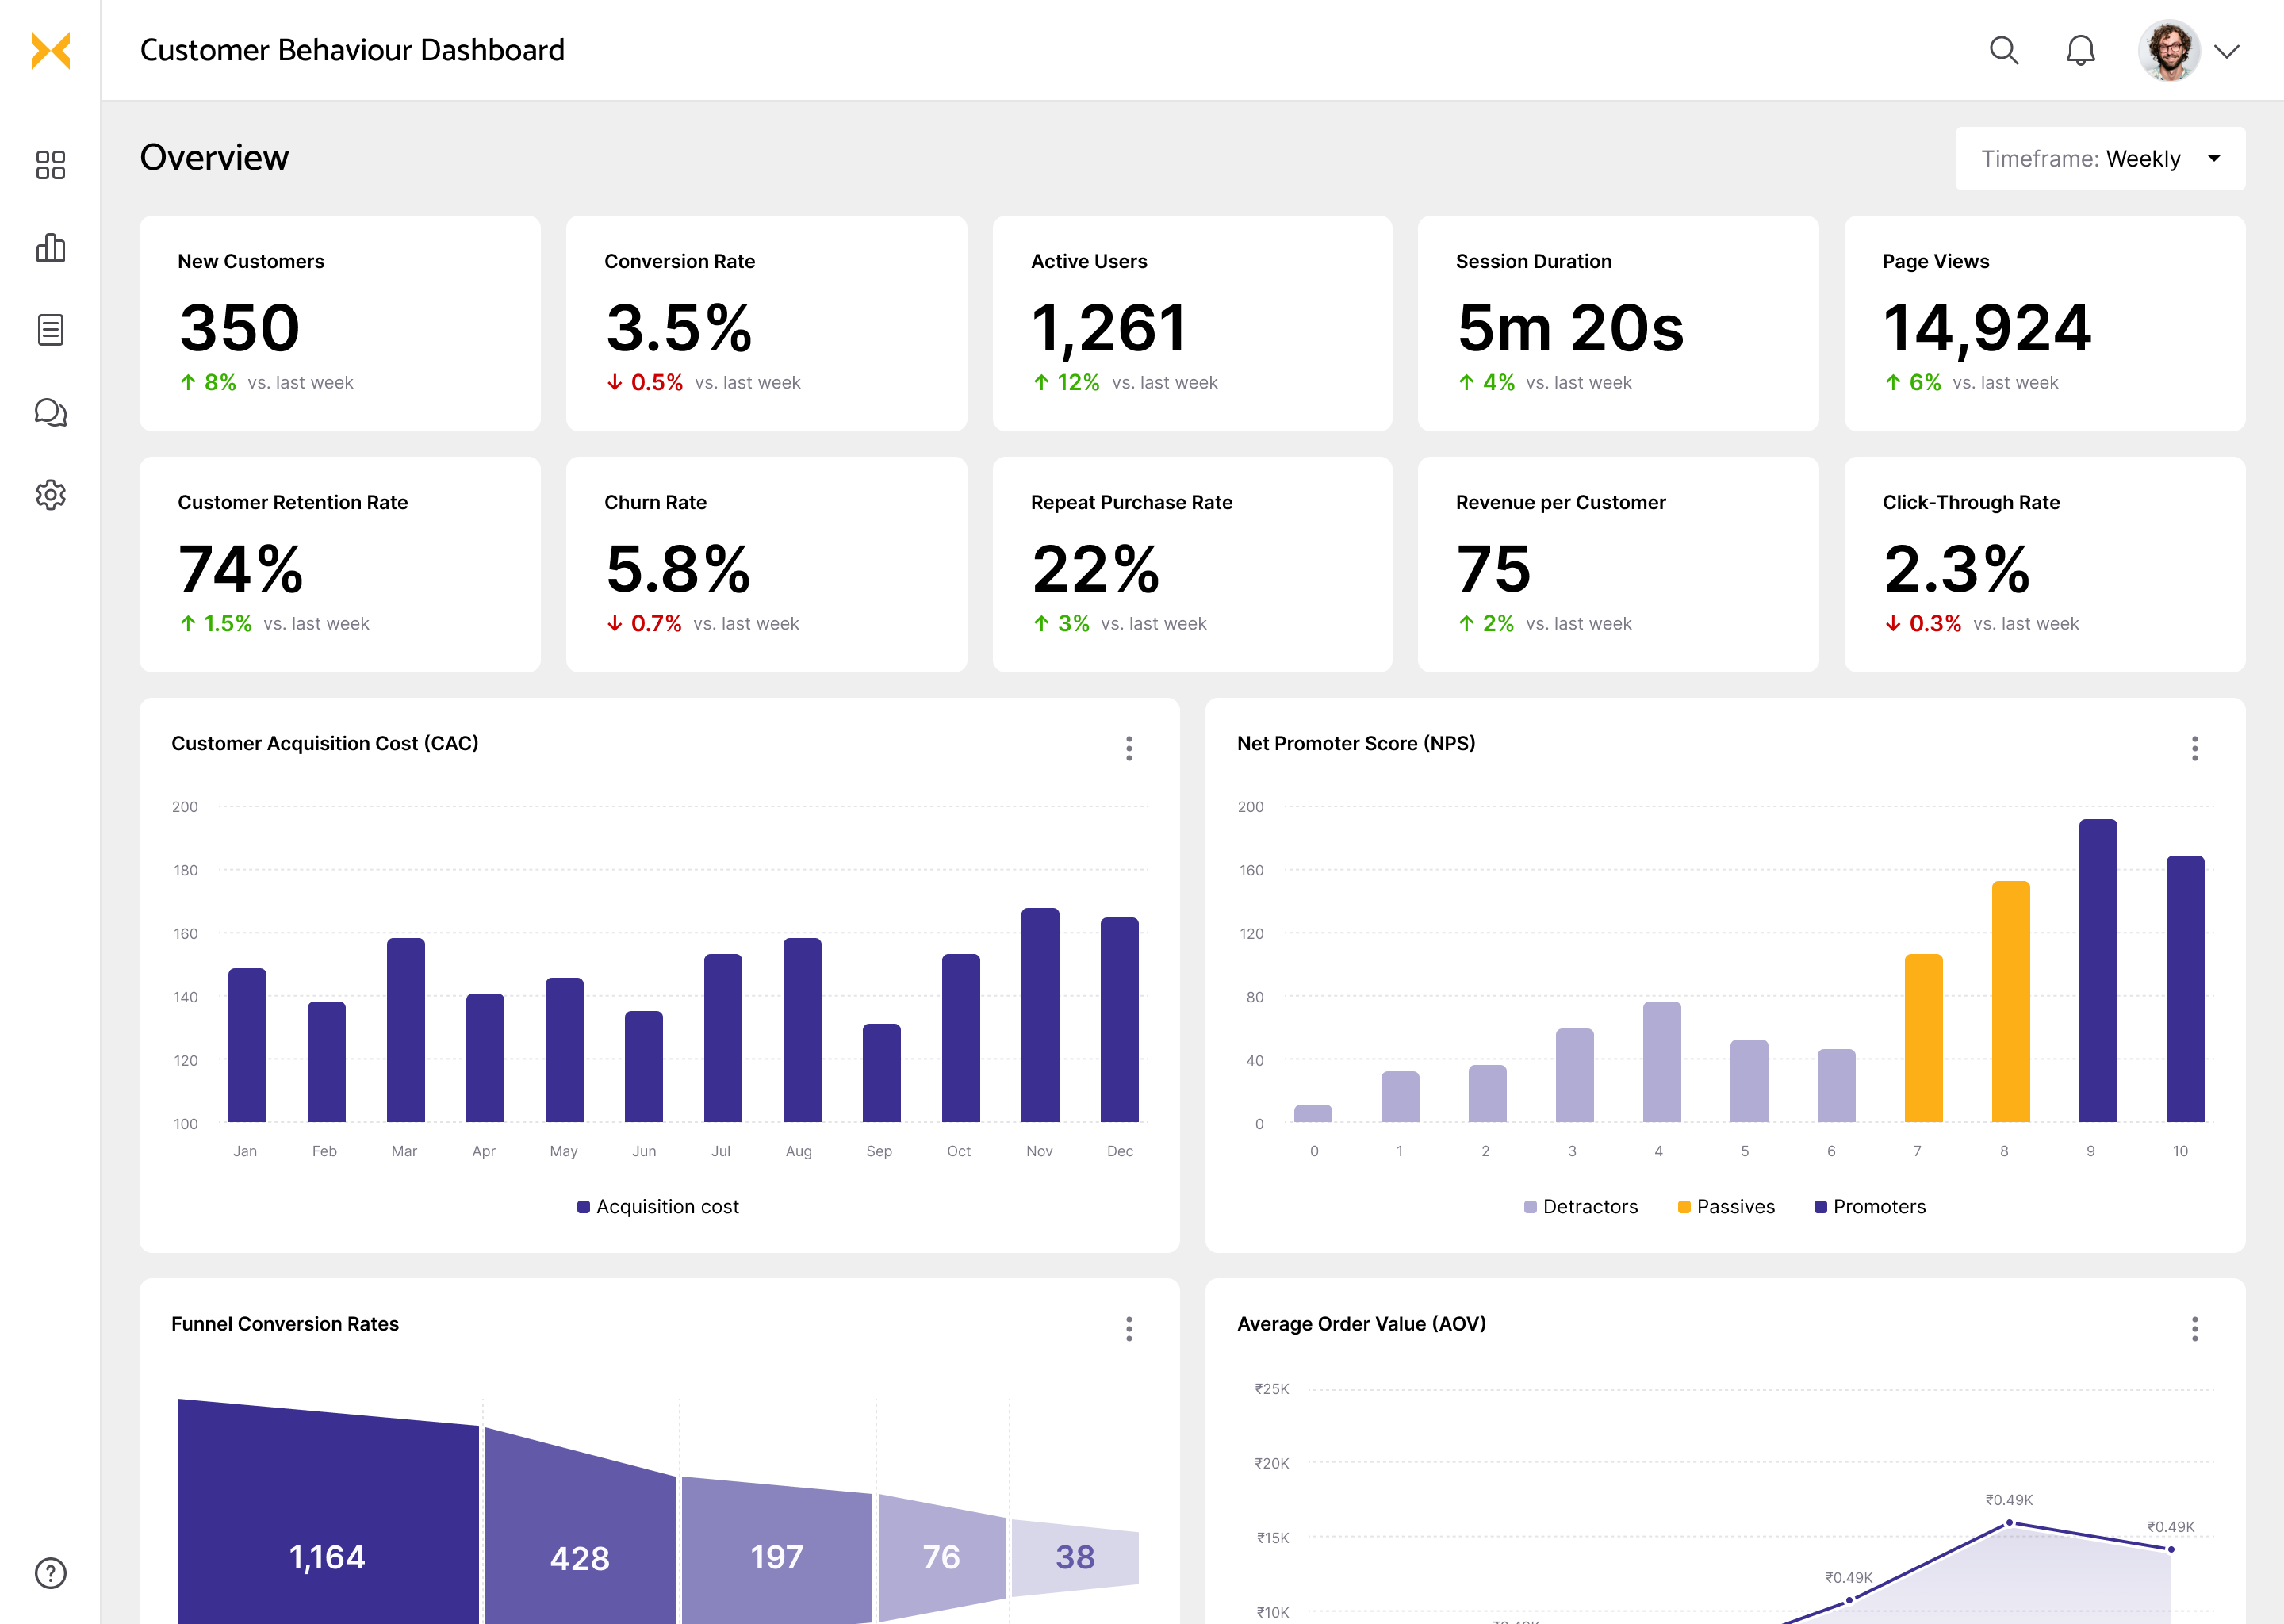
Customer behavior dashboard
Learn beyond customer spending & transactions. Spot and track customer behaviors, customer habits, repurchases, plans and upgrades, and their overall journey with you.
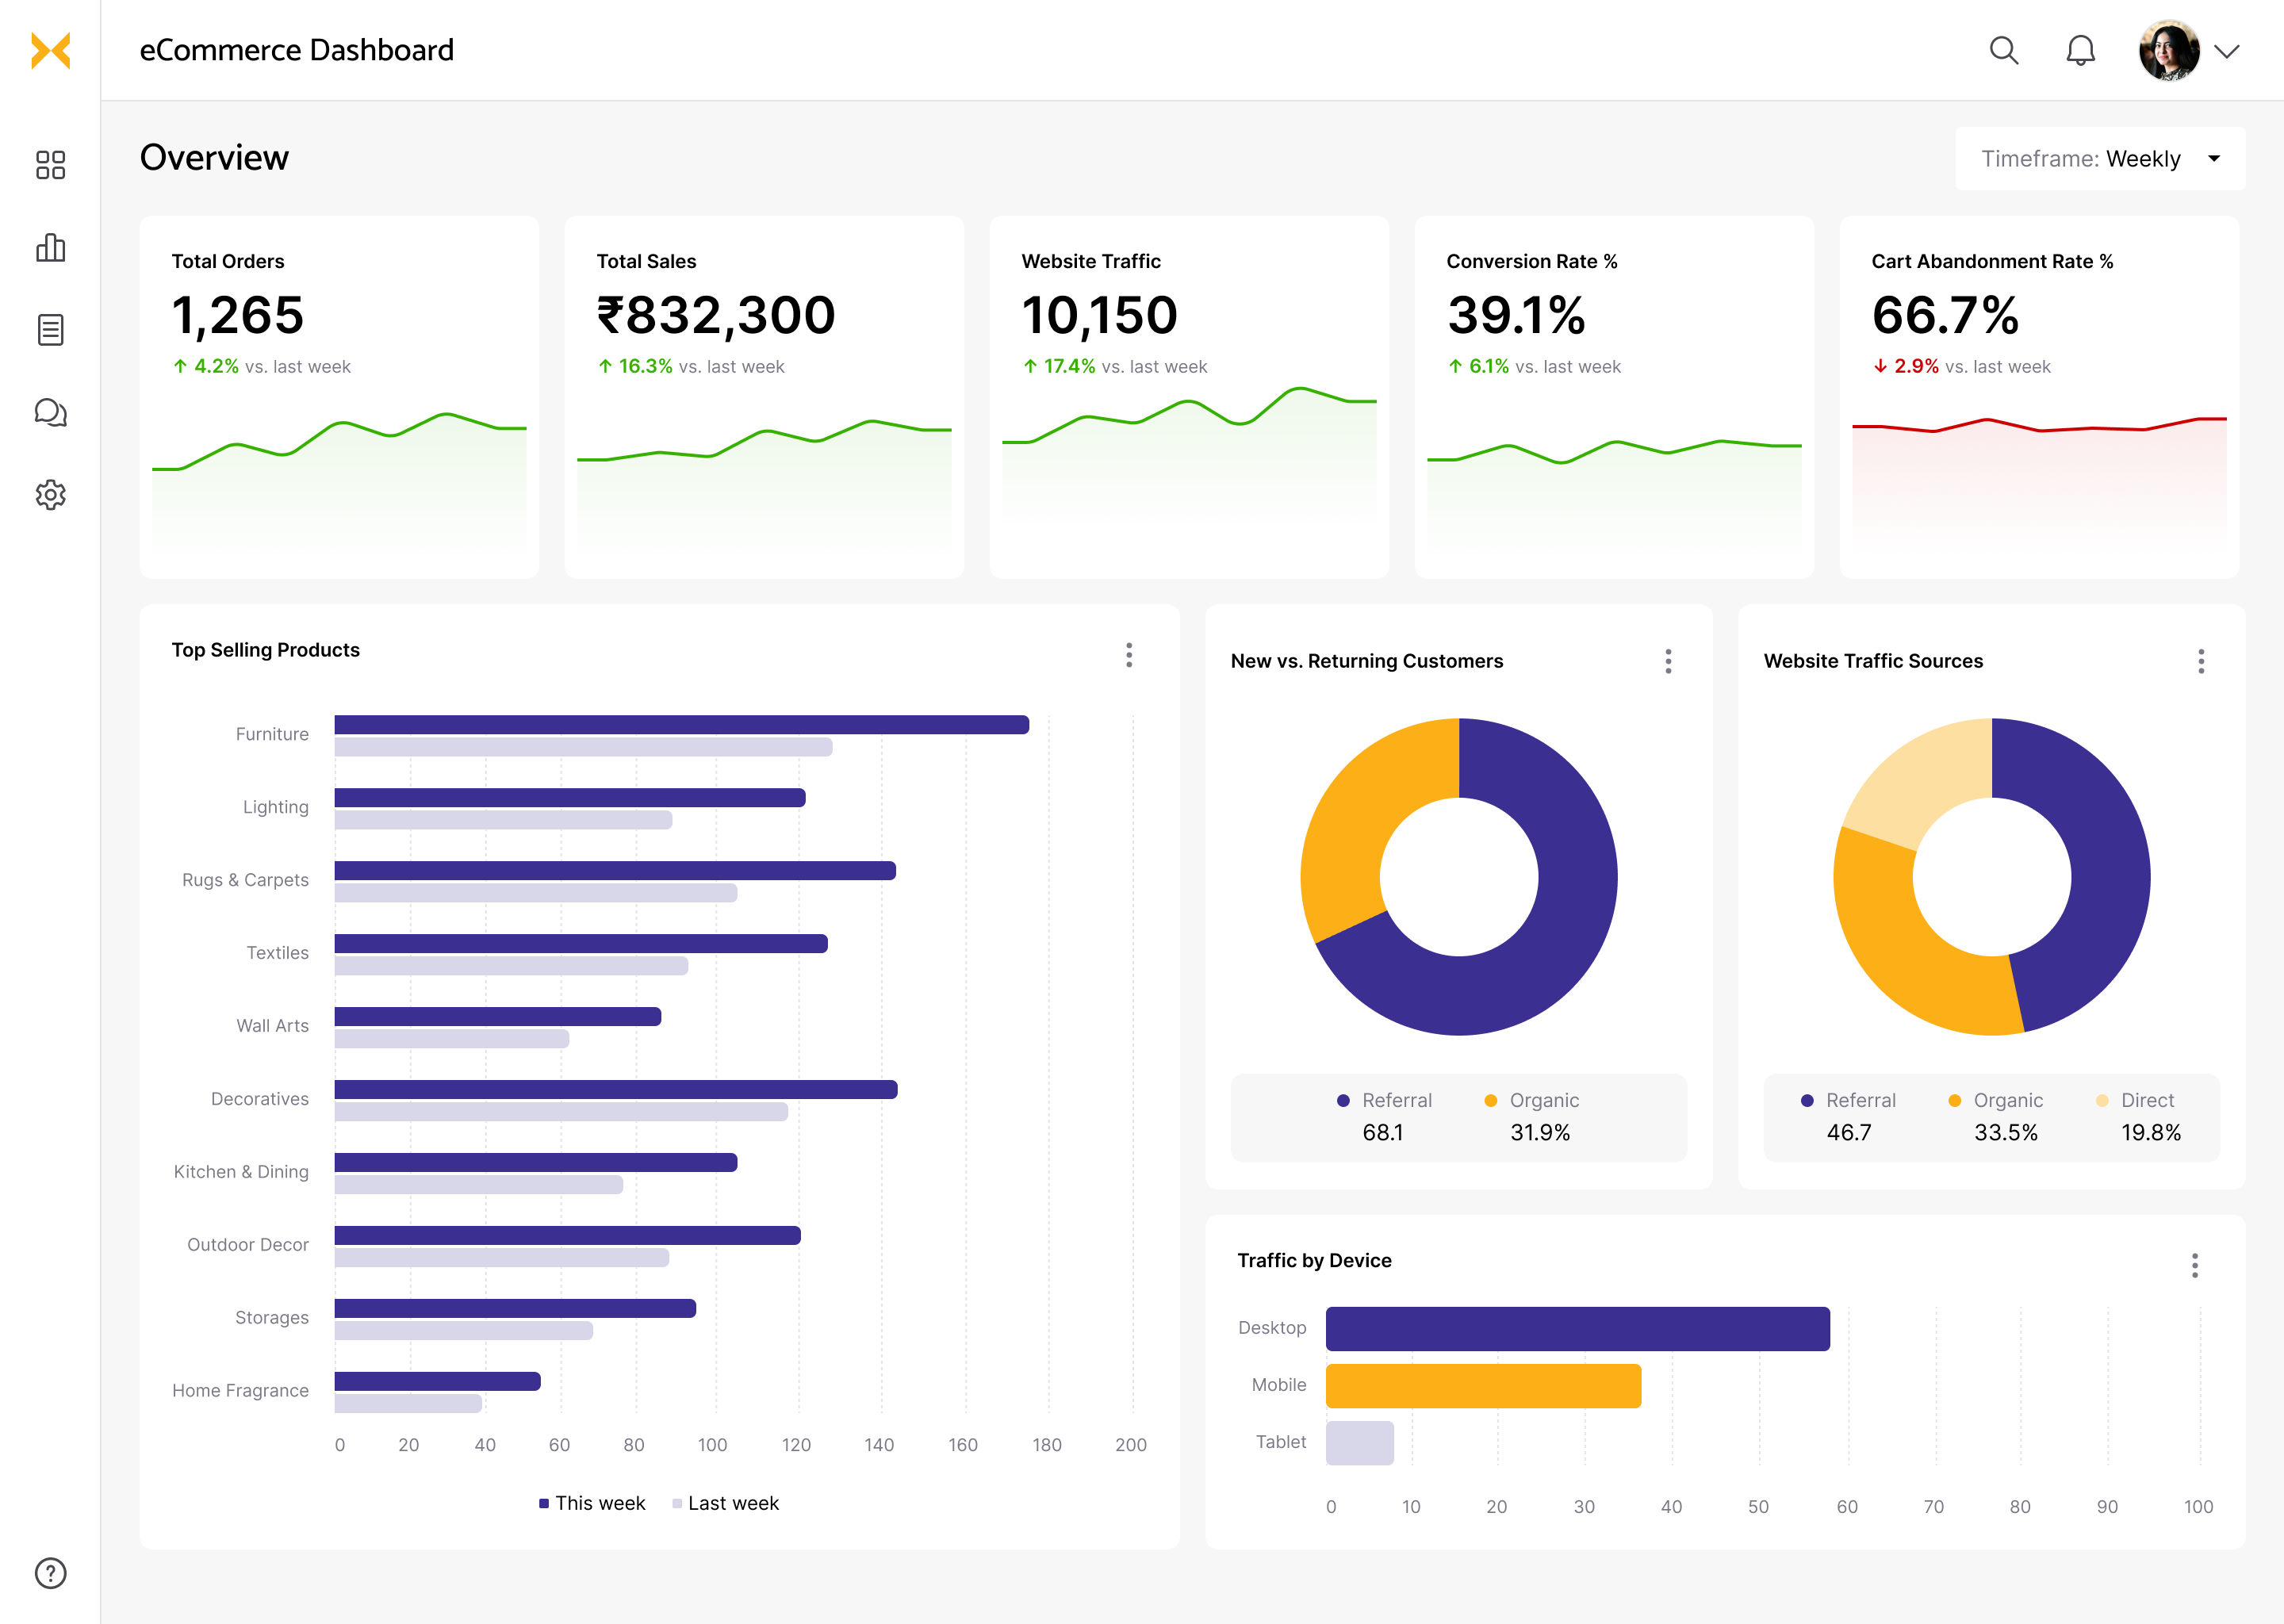
eCommerce dashboard
The one-stop data shop of an online shop—top selling products, revenue, region-wise traffic, conversion, and the whole shebang. More elaborate than what you can find in your monthly analytics reports.
Why datakulture?
Why datakulture?
10+
Years of experience
50+
Projects delivered
20+
Certified data & BI consultants
96%
Satisfactory customers

Dashboard by roles
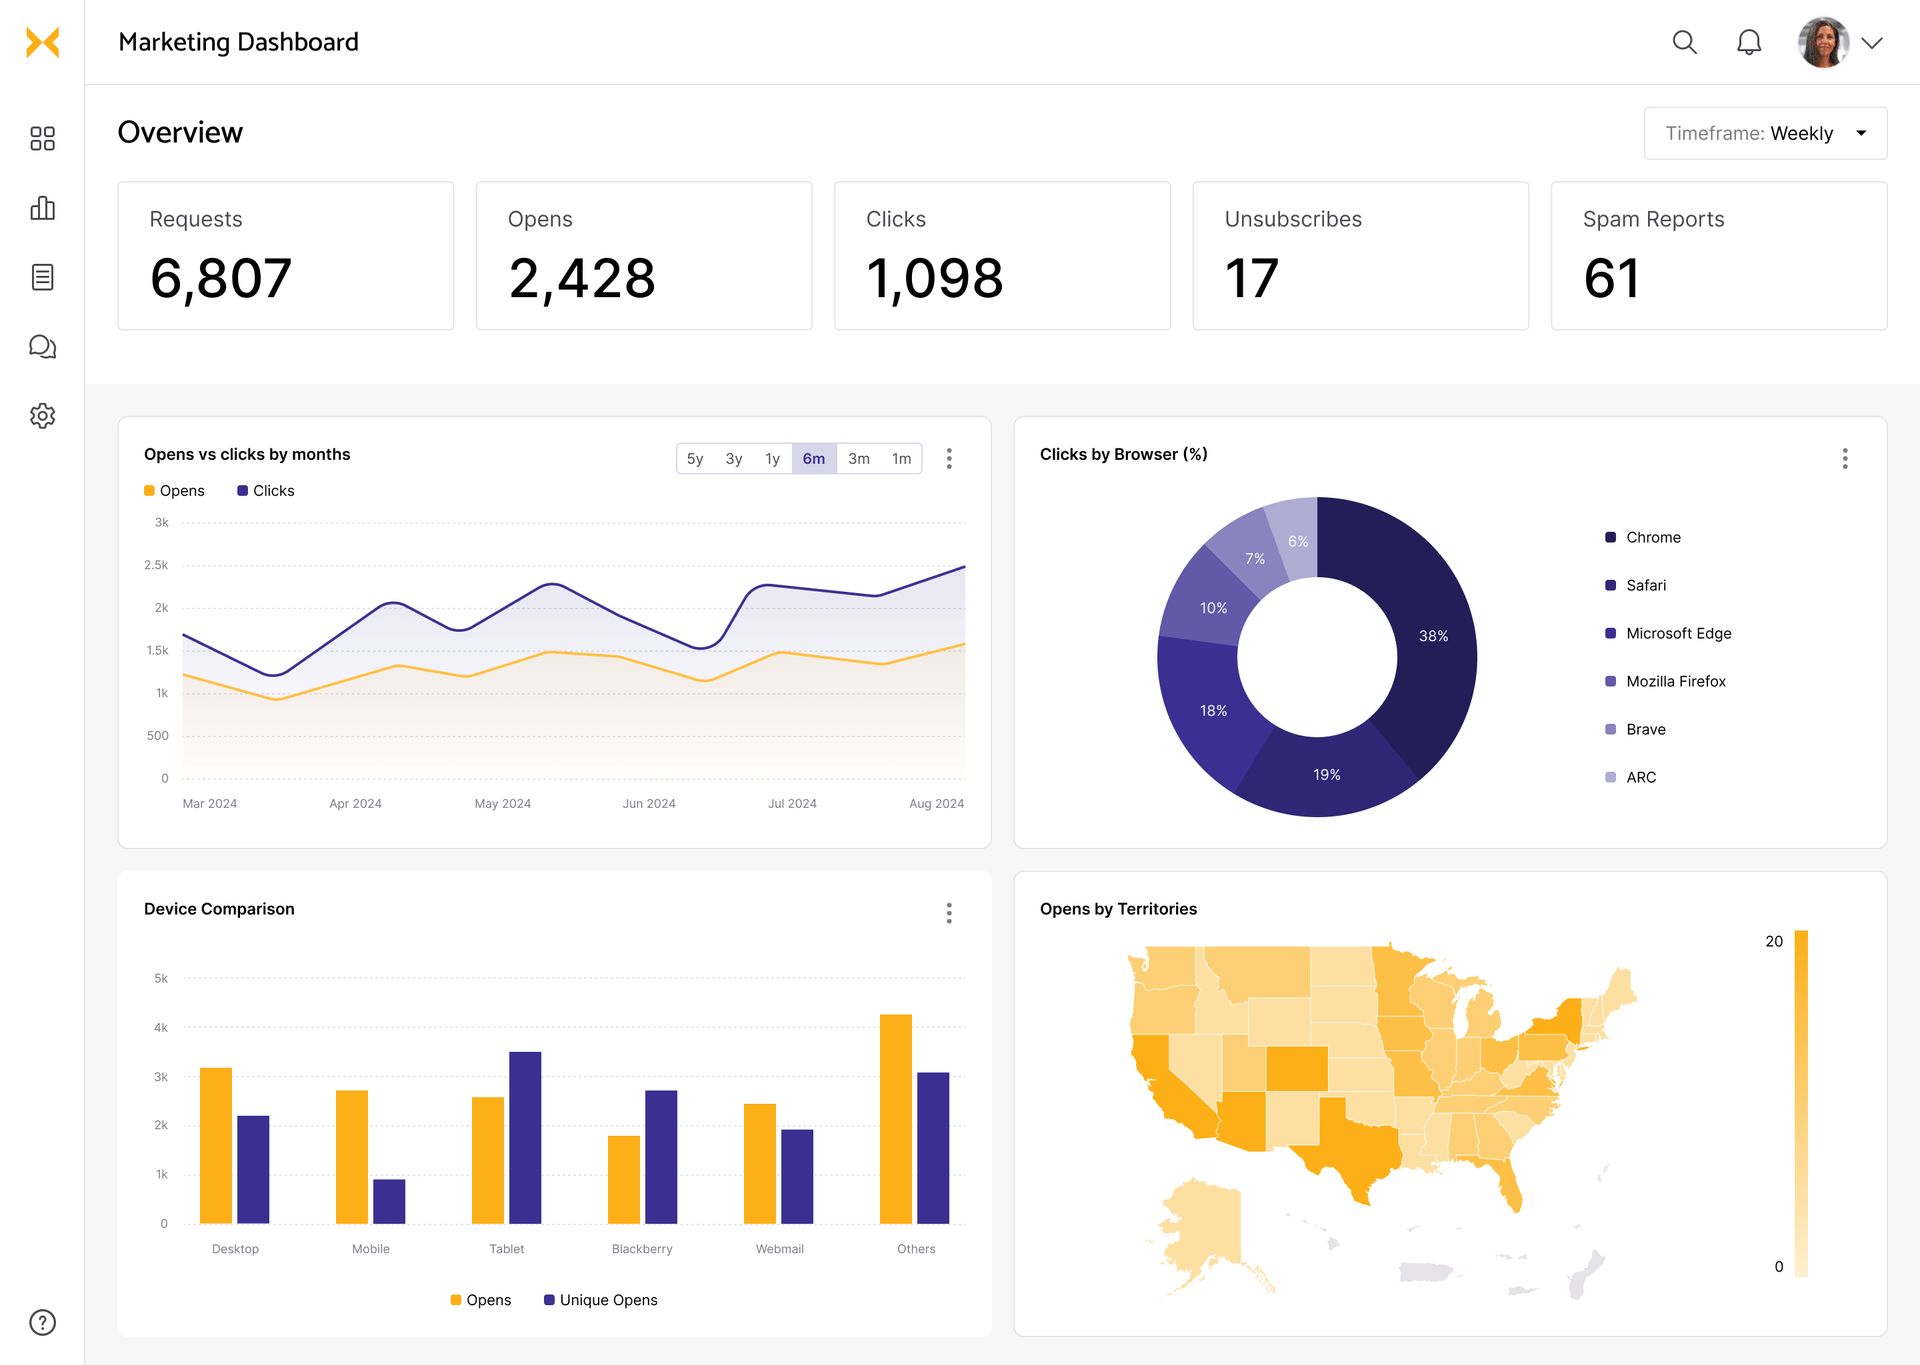
Marketing dashboard examples
ROI to socials to growth - made to suit both matured marketing teams, one person marketers, and agencies.
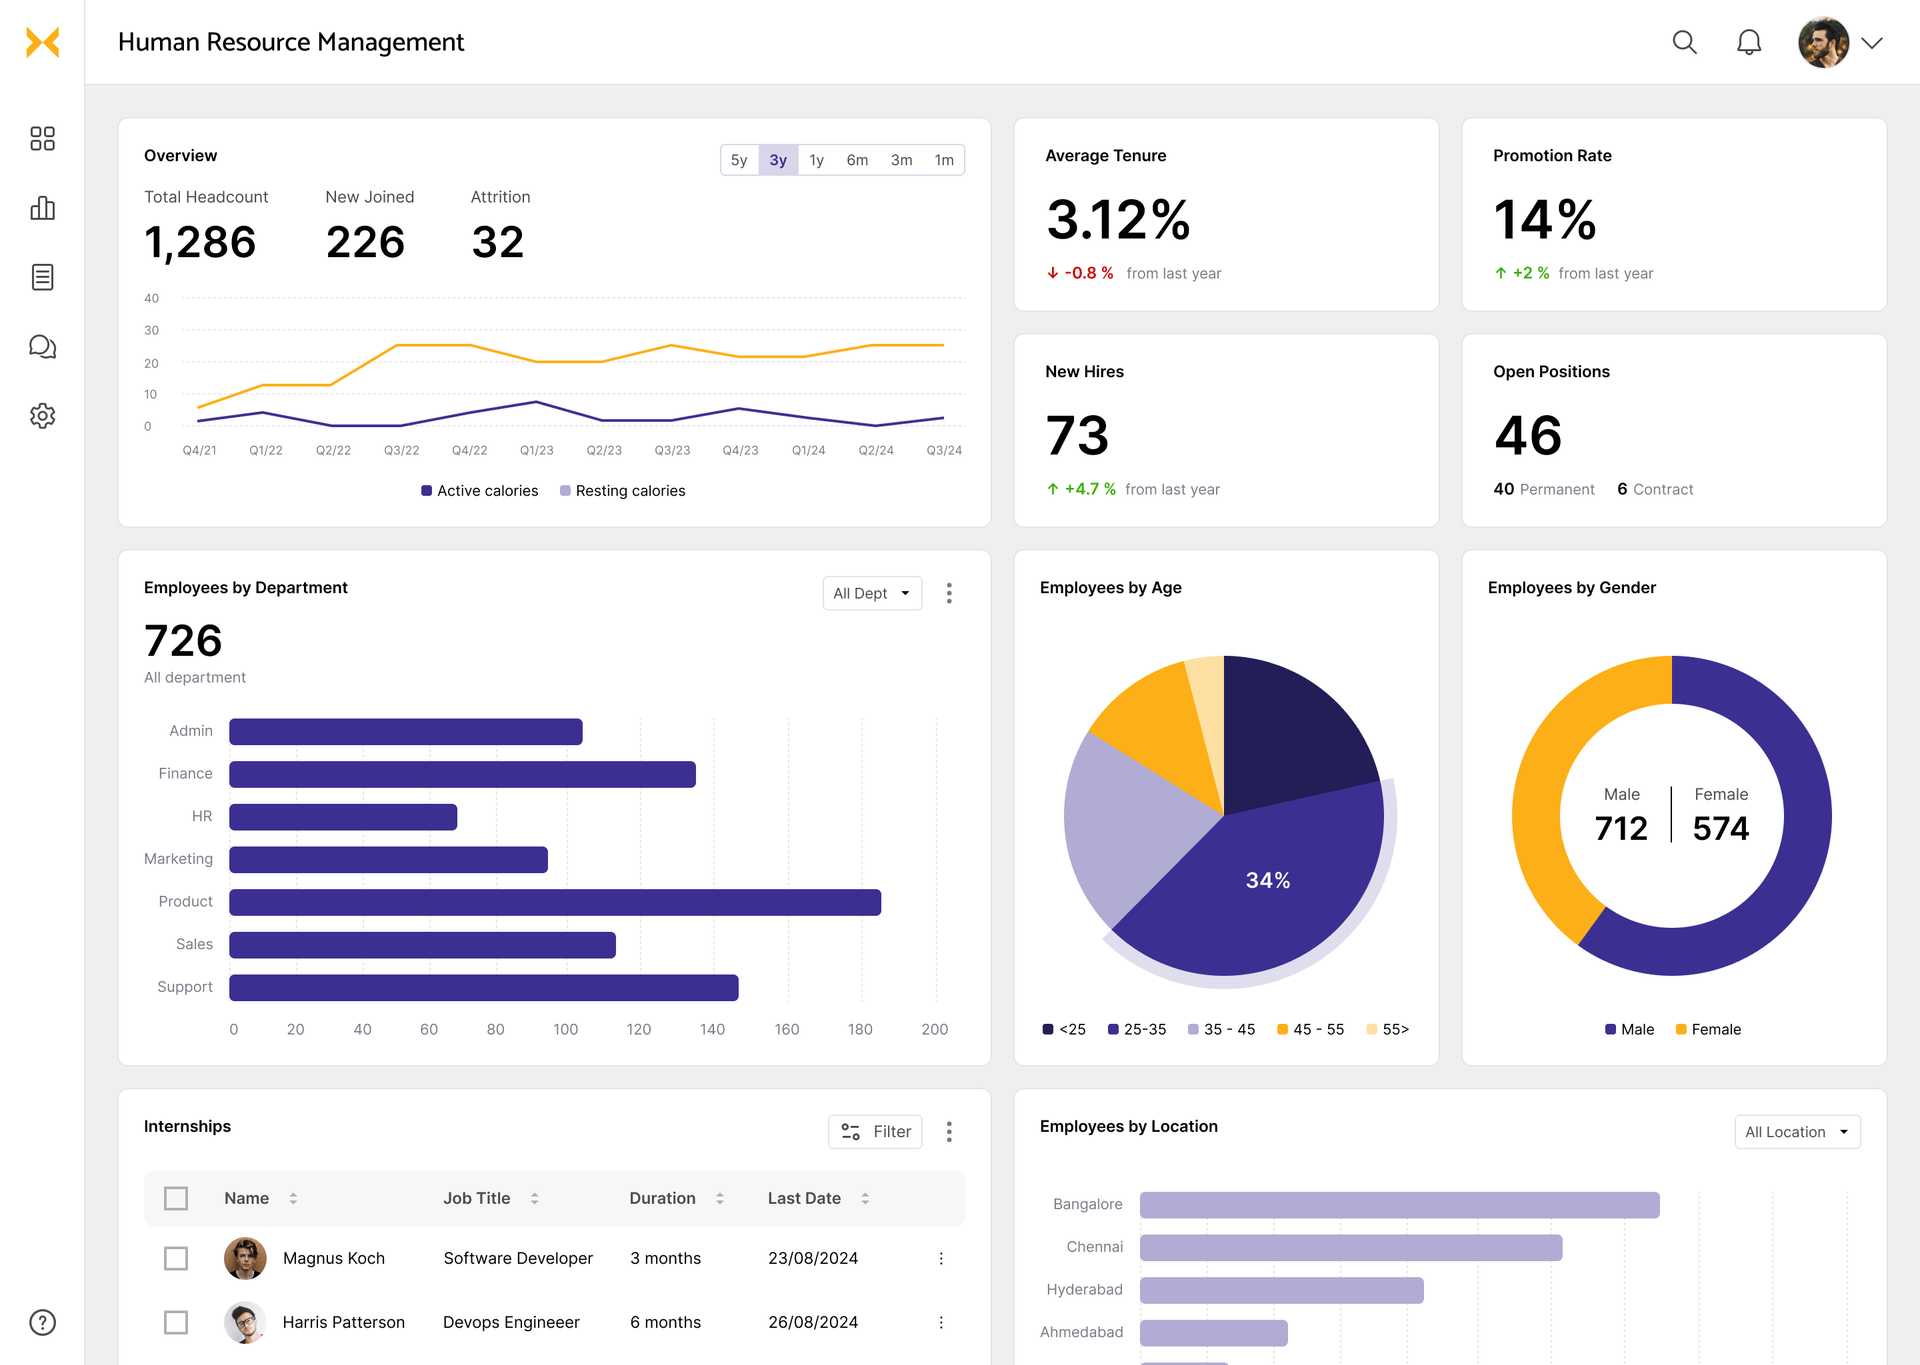
HR dashboard examples
Catch up on what’s happening in your company - from talent management to hiring to productivity
Dashboard by industry
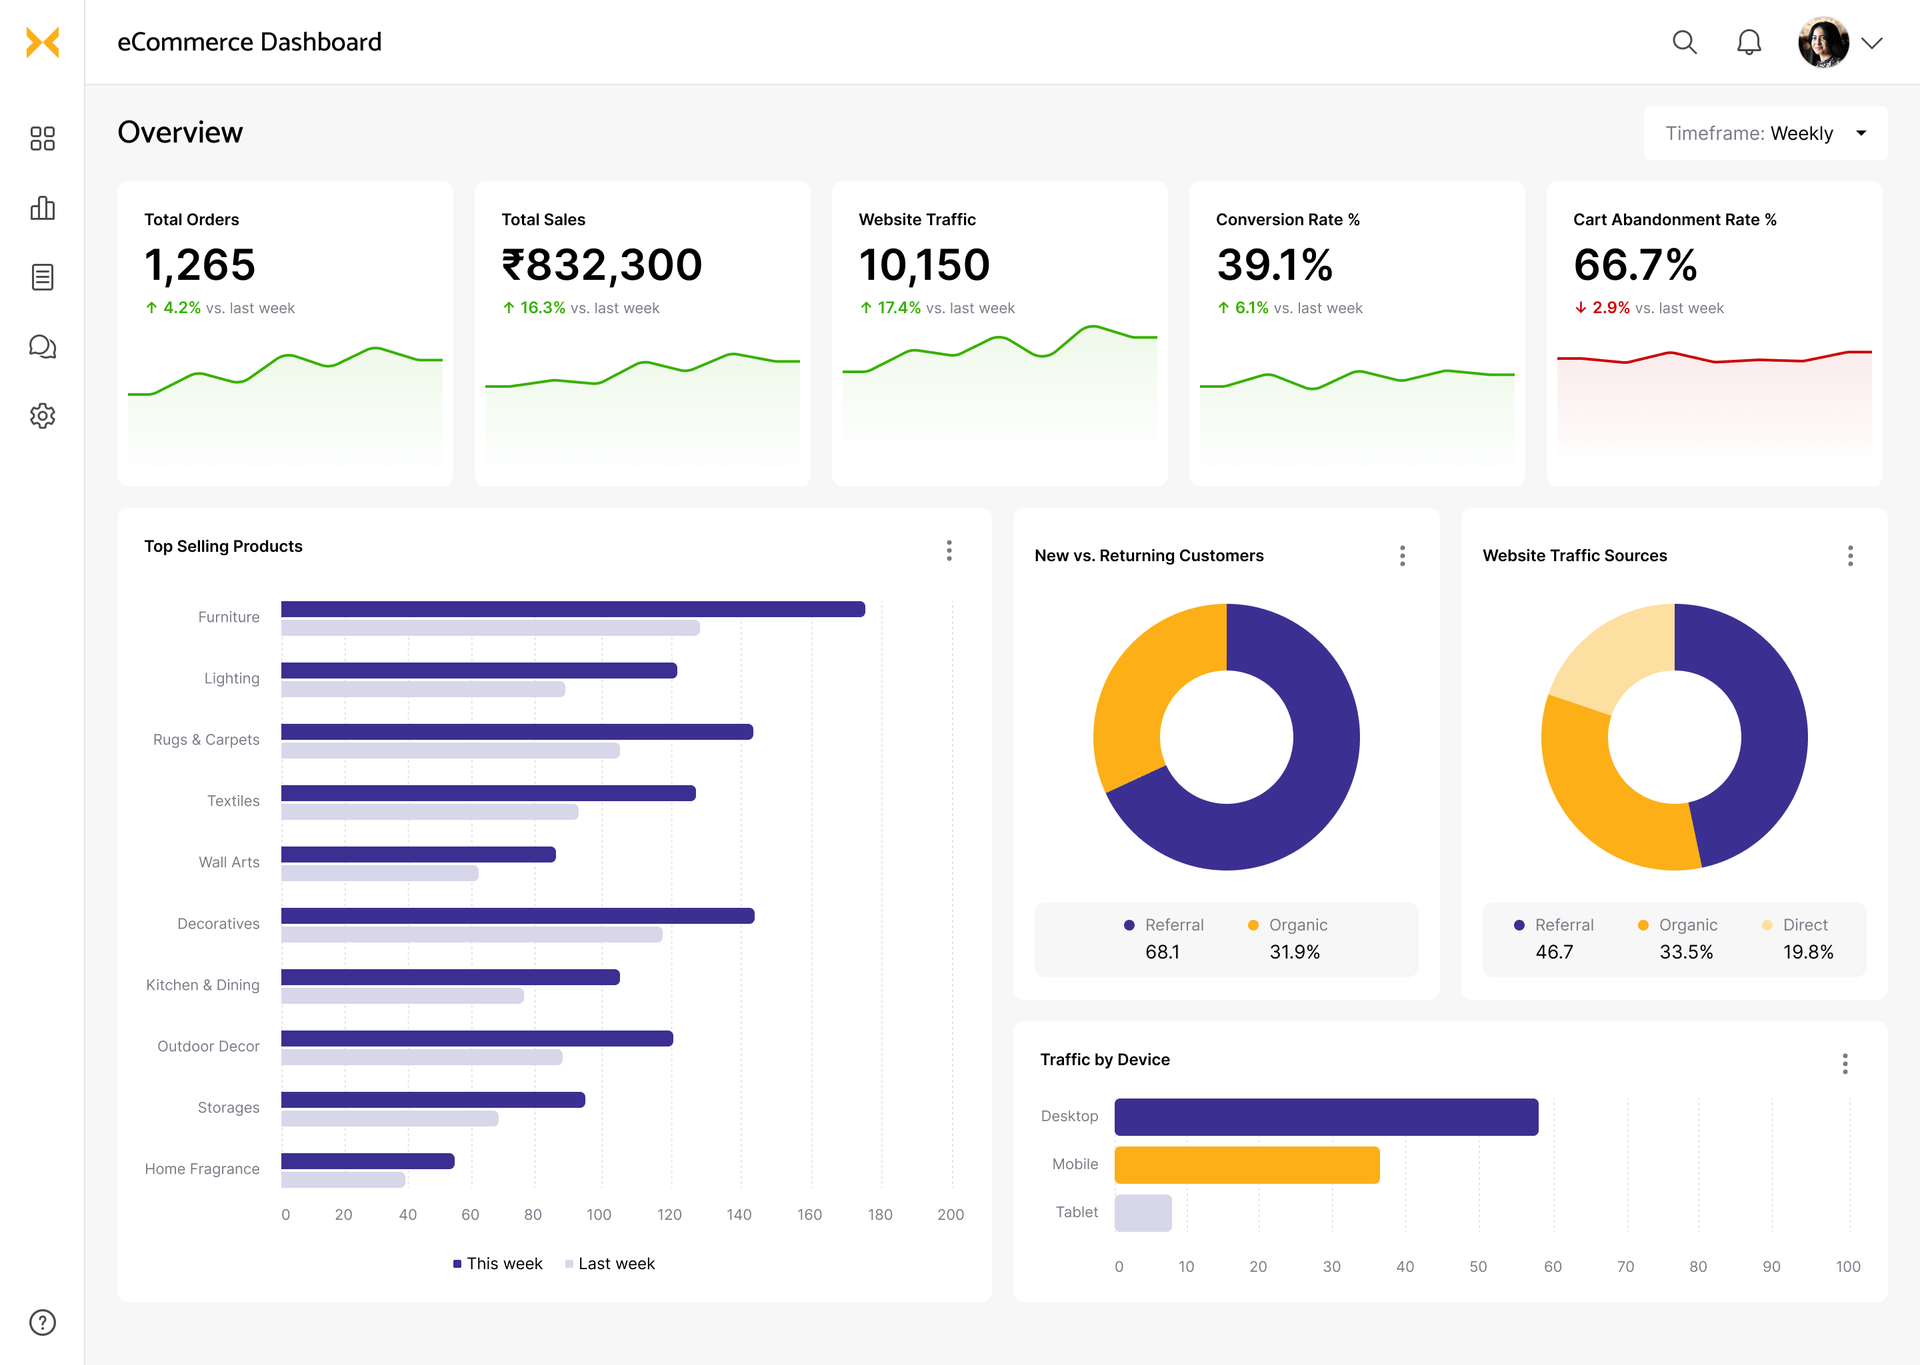
eCommerce dashboard examples
The one-stop data shop of an online shop—top selling products, revenue, region-wise traffic, conversion, and the whole shebang. More elaborate than what you can find in your monthly analytics reports.
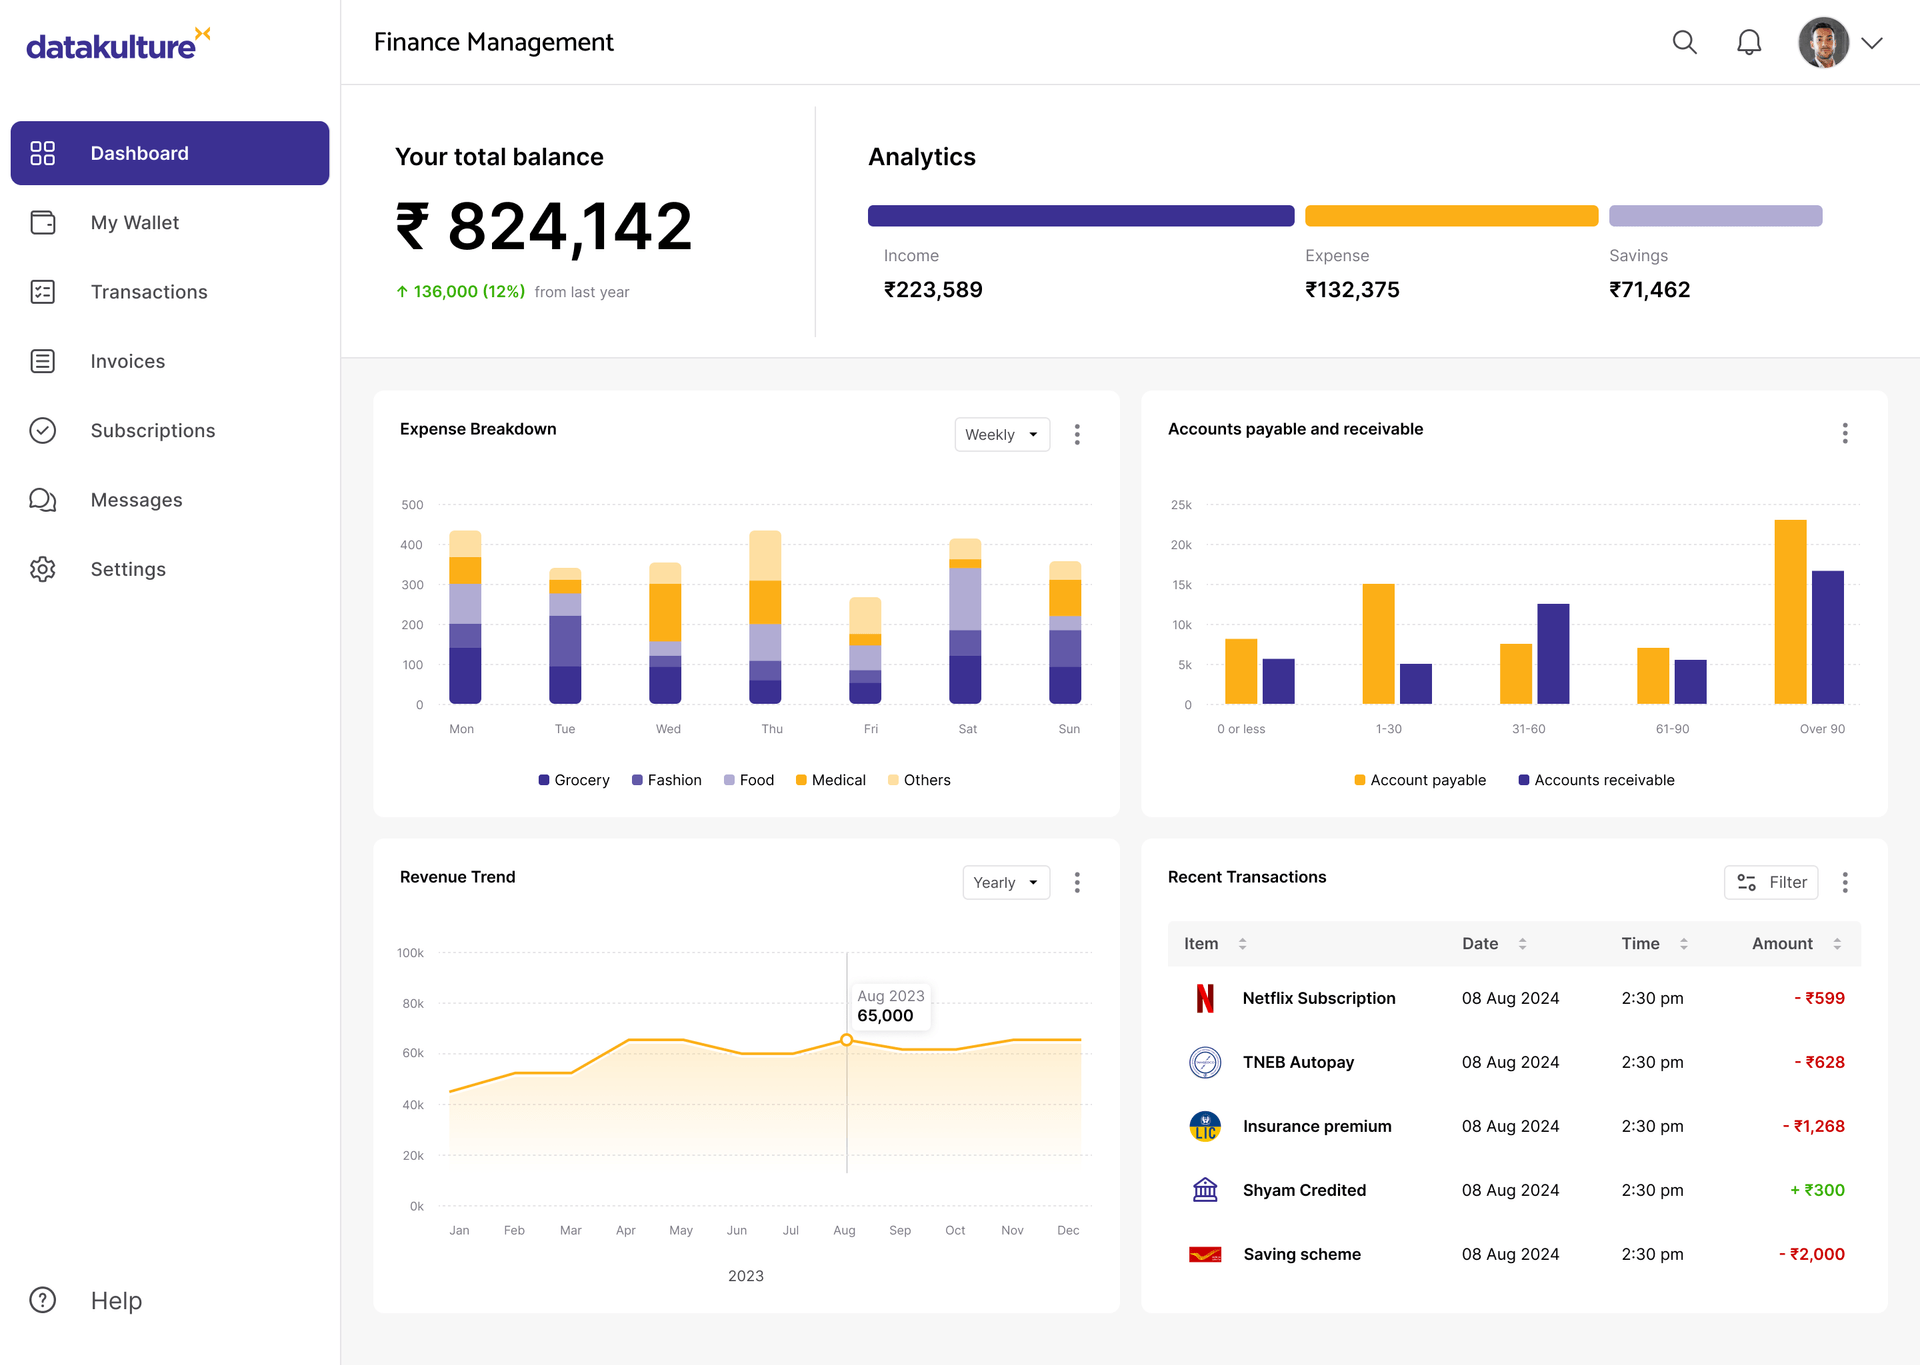
Finance dashboard examples
The window to your business wallet is here. Get a quick peek into your spending, income, top spends, etc., on a tap, visualized to your liking