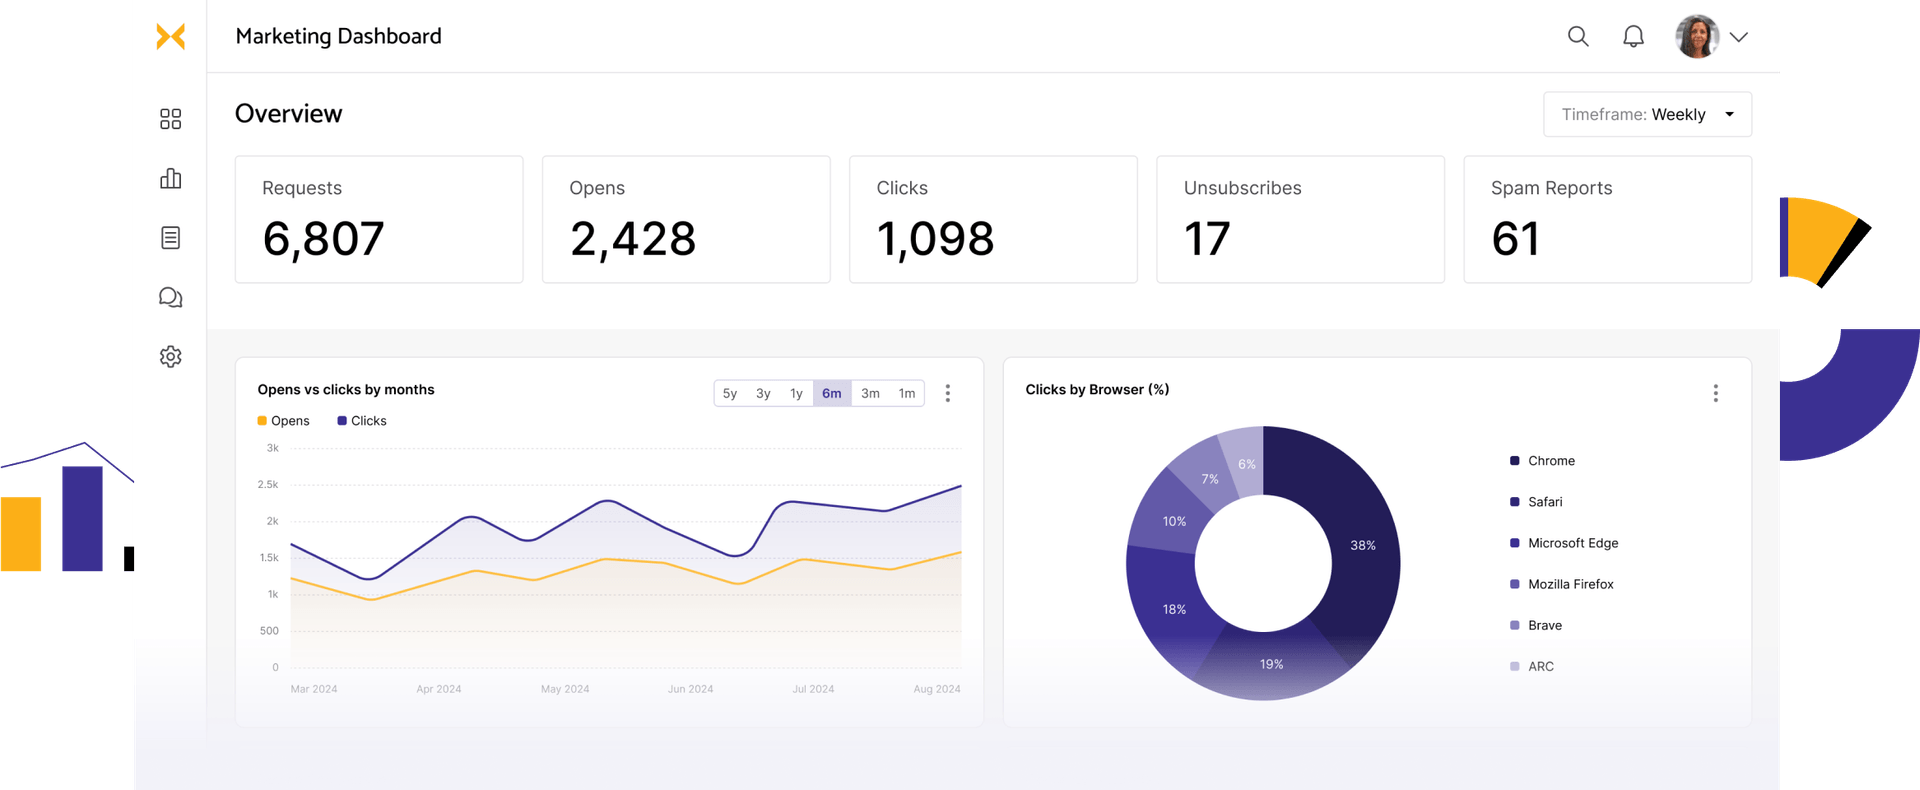

Marketing is guesswork. For those who do everything than tracking
Too many campaigns running in tandem, budget constraints, gotta be creative and stand out, must make tough choices every day - you need a place that could feel like you have got it all together (literally). Let that be a dashboard. 📈
Many marketing tools. One place to track
14-days no-commitment POC. Schedule a call to initiate yours.
Build my dashboard
It’s all about details. This is what you'll find on your marketing dashboard.


Website visits
Site visits, traffic source and growth, top pages, heatmaps, customer interactions, and more.
Stay on top of visitors, website opens and clicks, including where they all come from, the device they view it from, demographics, and more.
Project summary and stats
Team productivity and effectiveness tracker
Find what’s your team’s occupied with, task status, relevant files, progress, effectiveness, and every other productivity status.
Paid channels
Growth cockpit of your ad and paid campaigns
Find out the ROI of every campaign and drill deep into them, to know spending, impressions, budget utilization, remaining budget, and everything else.
Conversions
Conversions from organic and paid - relevant pages and sources
Know what gets the user to perform the desired action, including detailed stats into clicks, sign ups, average time spent, etc., all collected and integrated from different data sources.
Social media impressions
A quick glance at social media presence and growth from all platforms
Get to know post clicks, impressions, engagement, and follower growth of social platforms in one place.
Types of dashboards for your different business needs
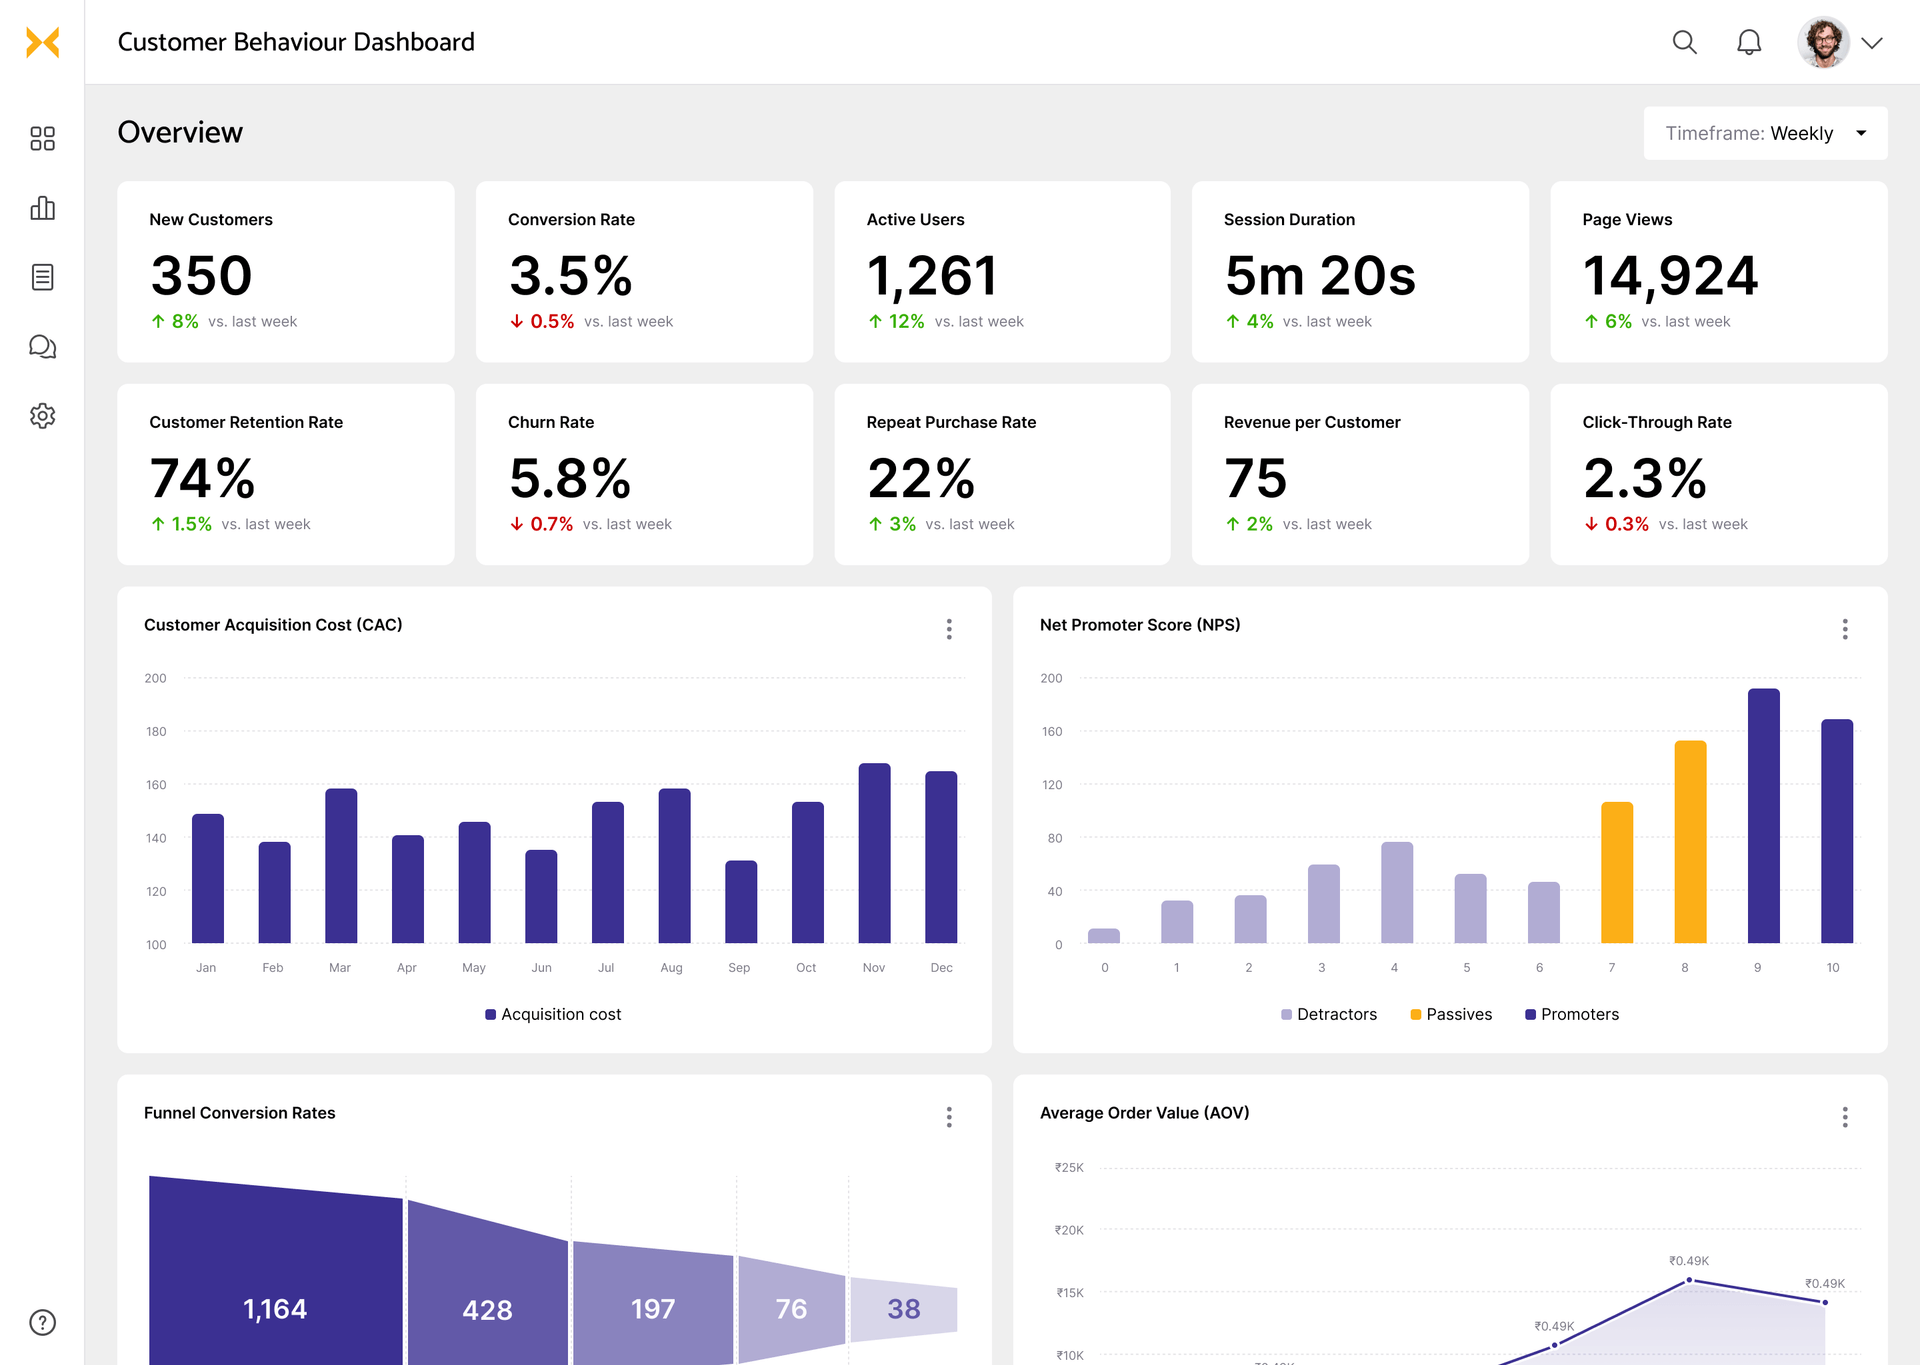
Customer behavior dashboard
Learn beyond customer spending & transactions. Spot and track customer behaviors, customer habits, repurchases, plans and upgrades, and their overall journey with you.
Why datakulture?
Why datakulture?
10+
Years of experience
50+
Projects delivered
20+
Certified data & BI consultants
96%
Satisfactory customers

Dashboard by roles
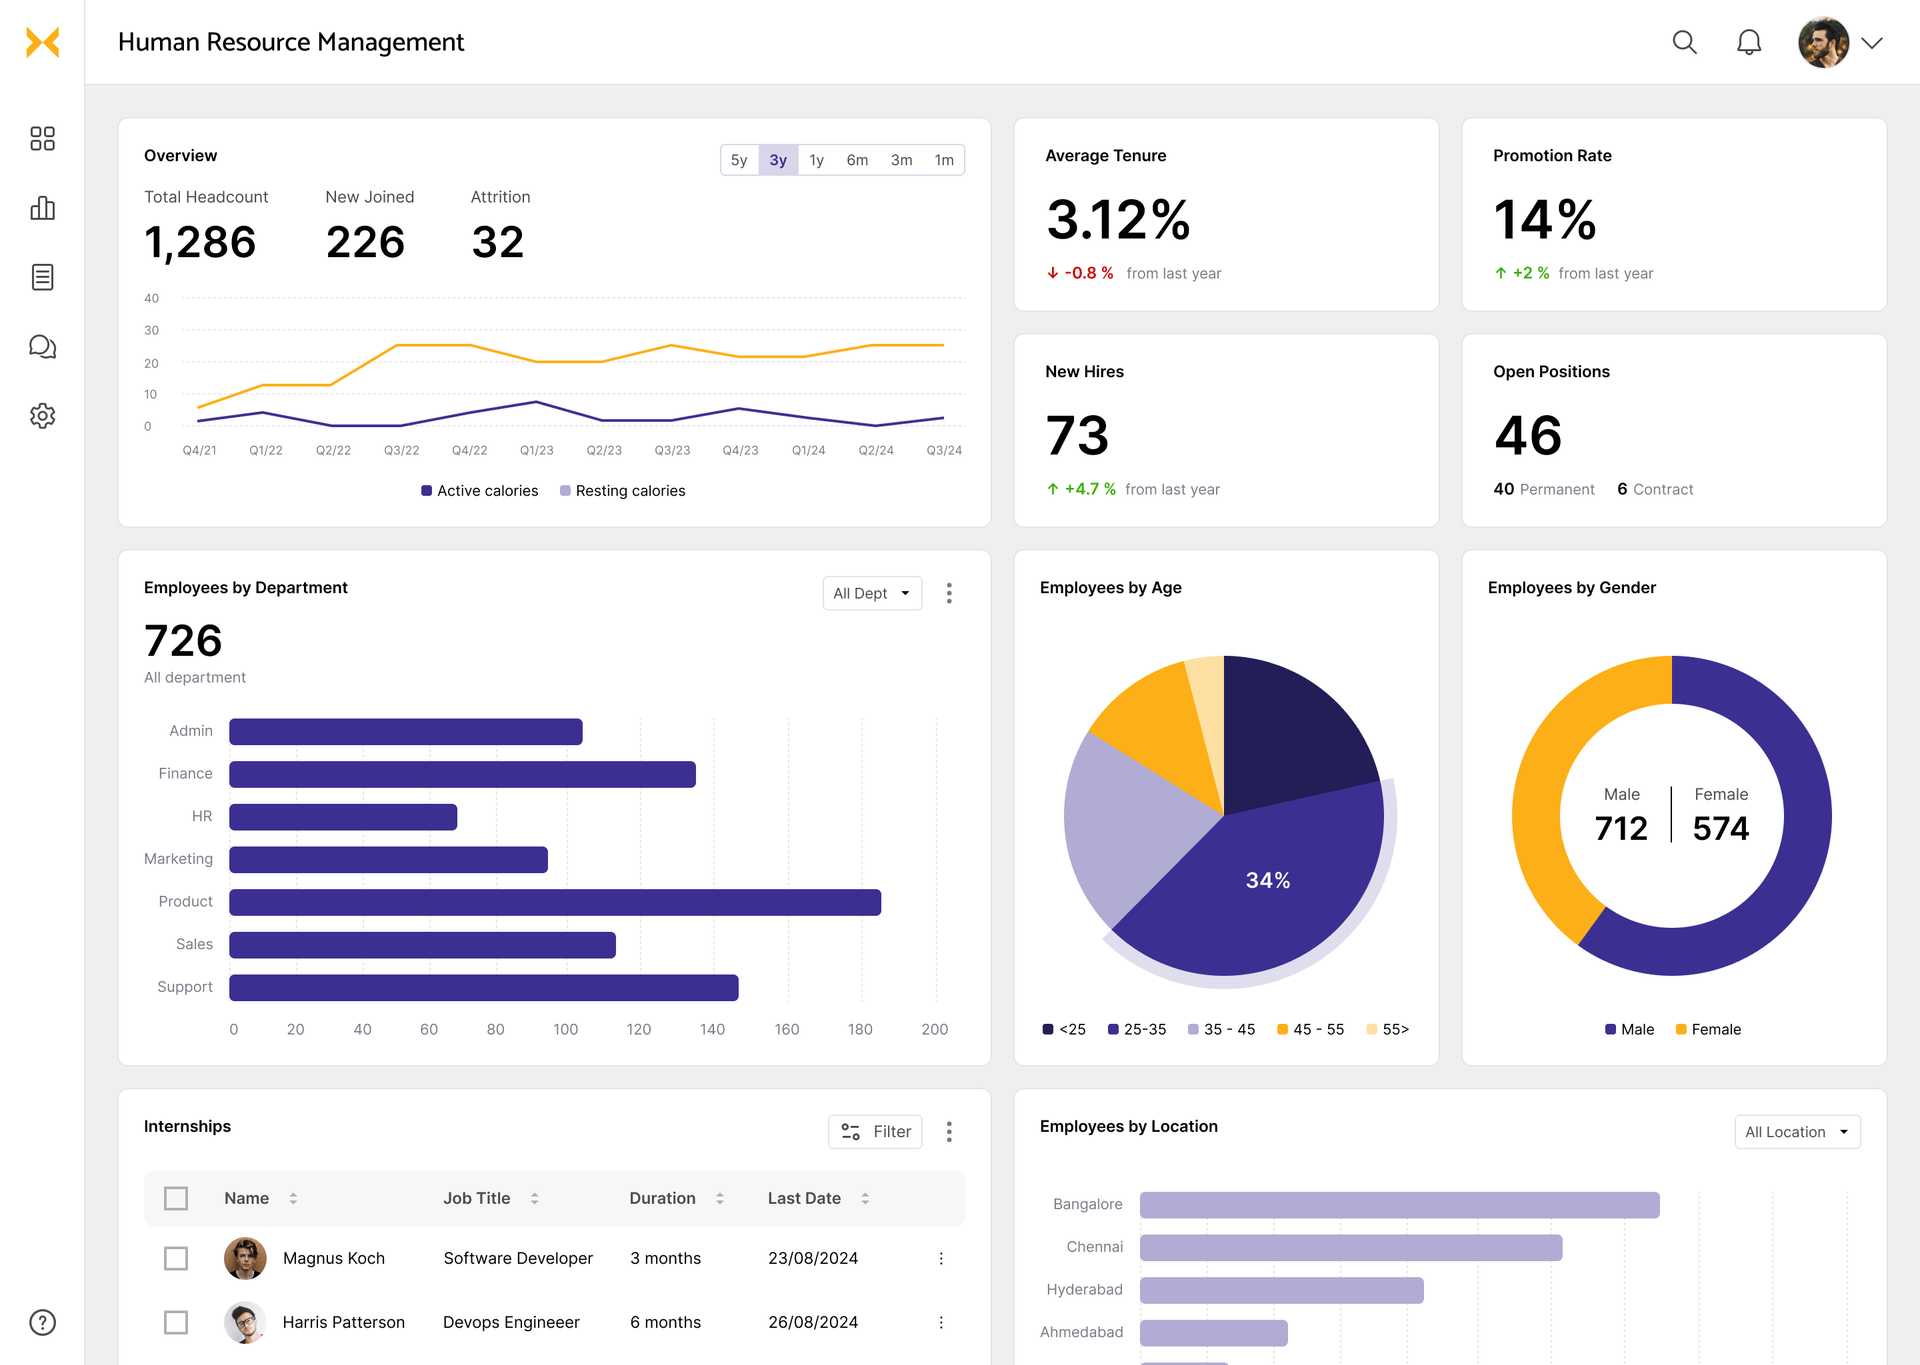
HR dashboard examples
Catch up on what’s happening in your company - from talent management to hiring to productivity
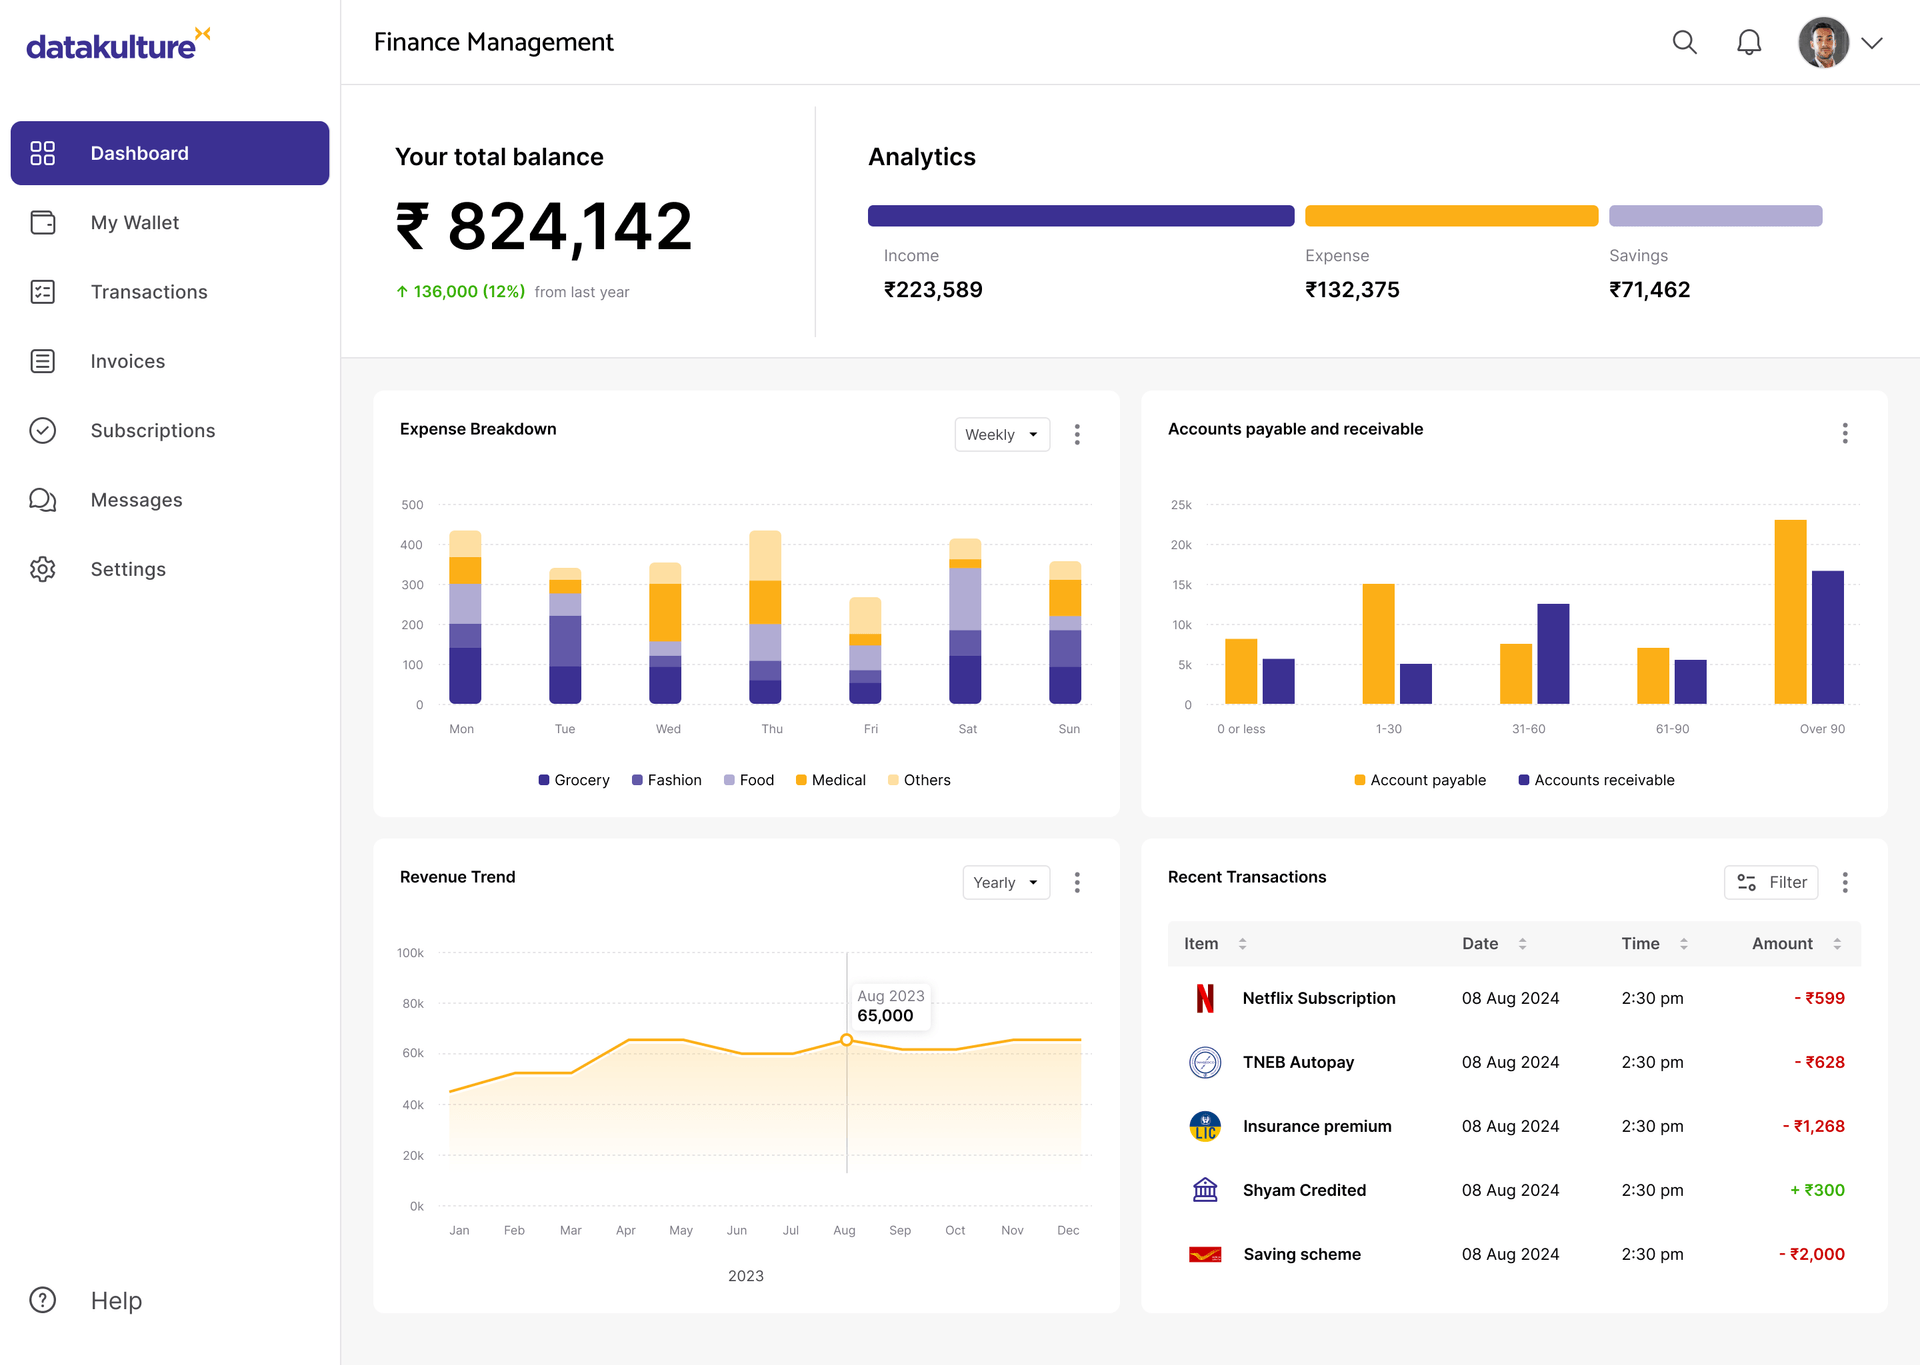
Finance dashboard examples
The window to your business wallet is here. Get a quick peek into your spending, income, top spends, etc., on a tap, visualized to your liking
Dashboard by industry
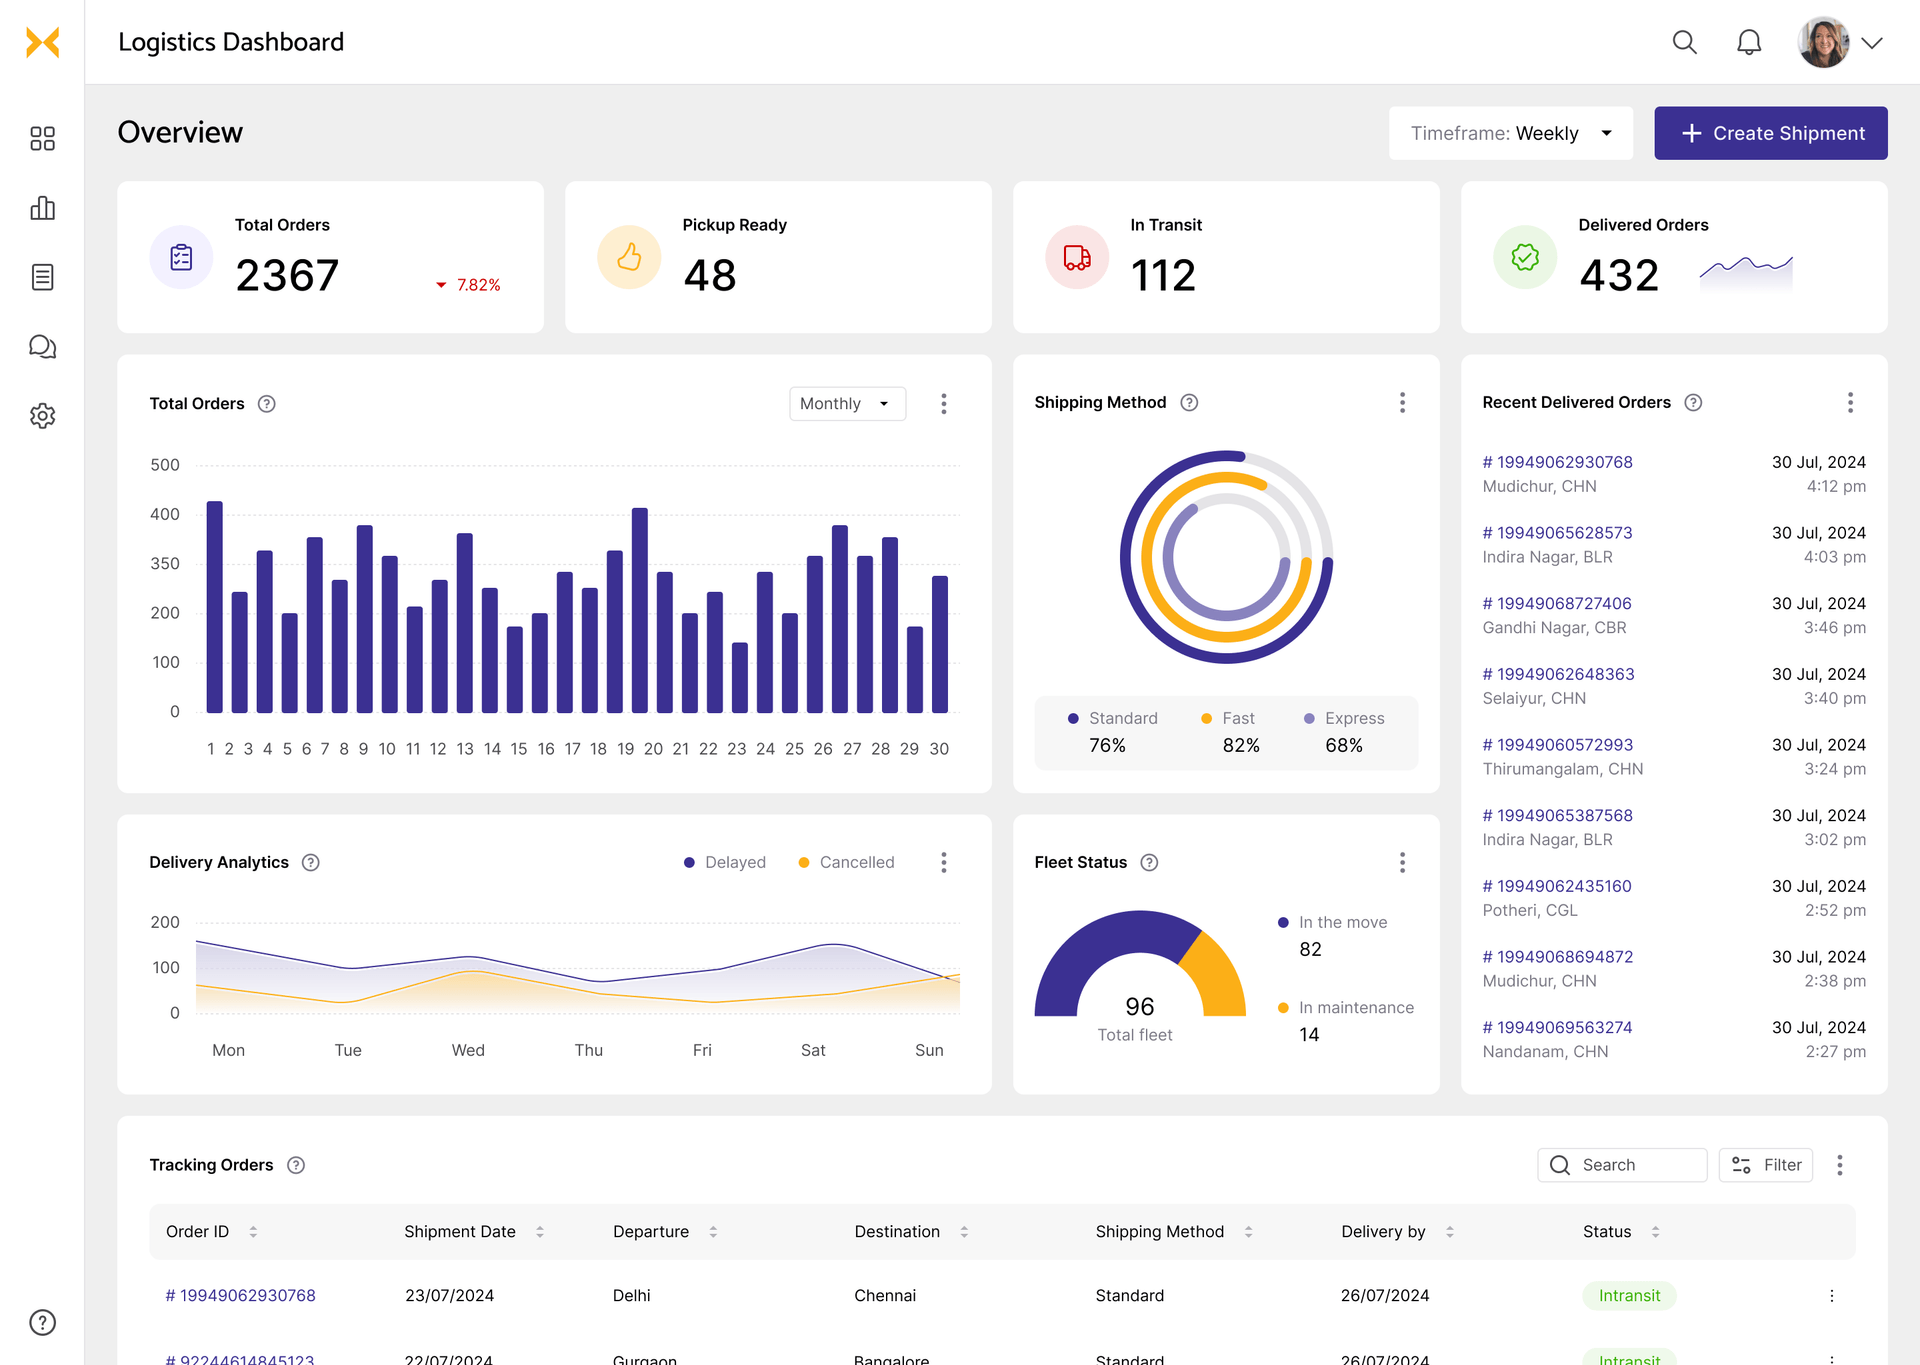
Logistics dashboard examples
Monitor your key KPIs in one place - from warehouse operations to transportation to supply chain management.
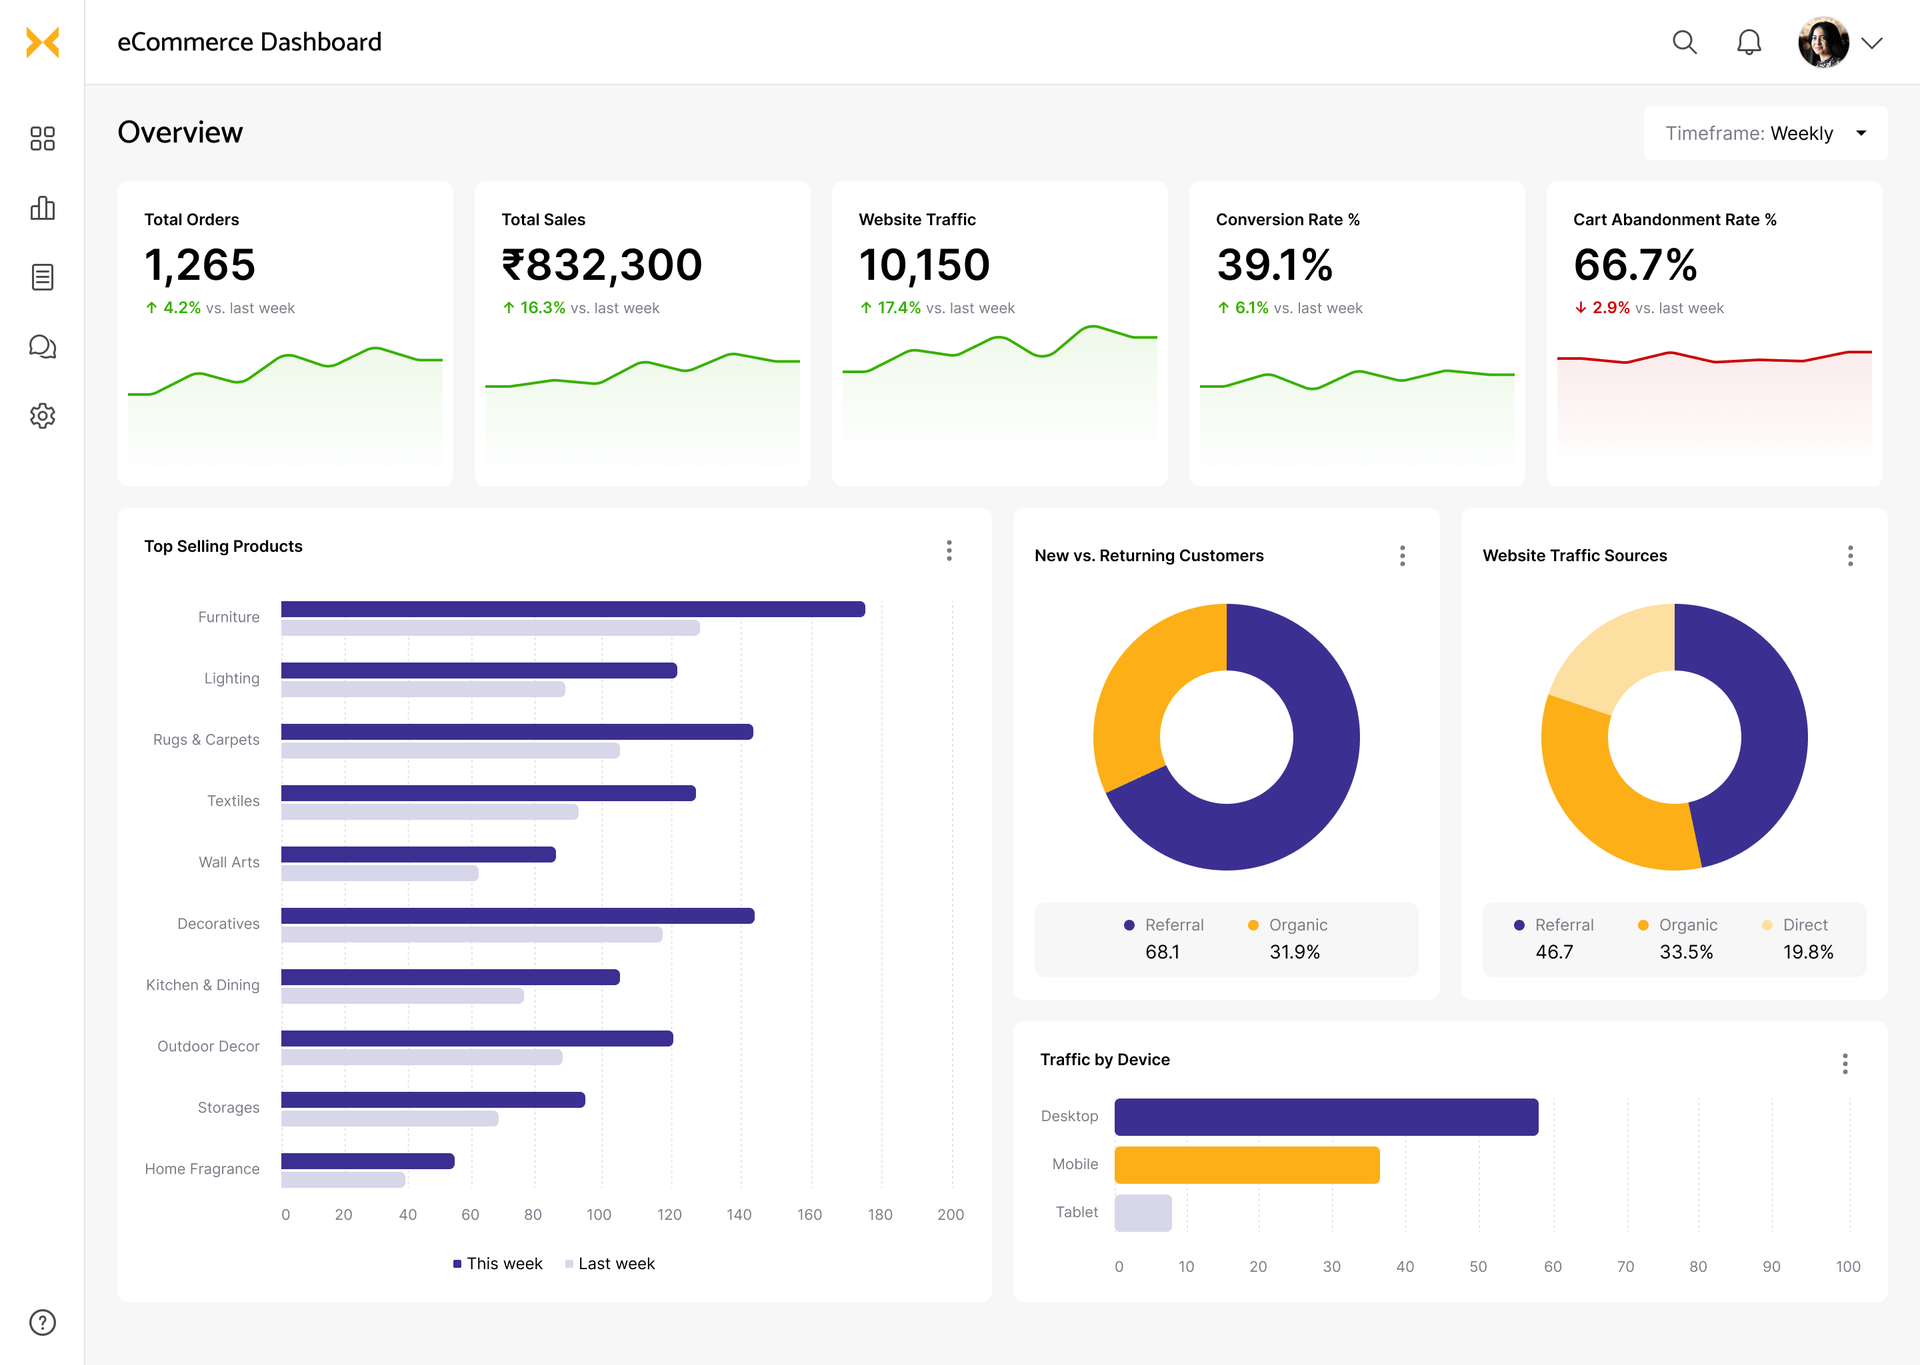
eCommerce dashboard examples
The one-stop data shop of an online shop—top selling products, revenue, region-wise traffic, conversion, and the whole shebang. More elaborate than what you can find in your monthly analytics reports.
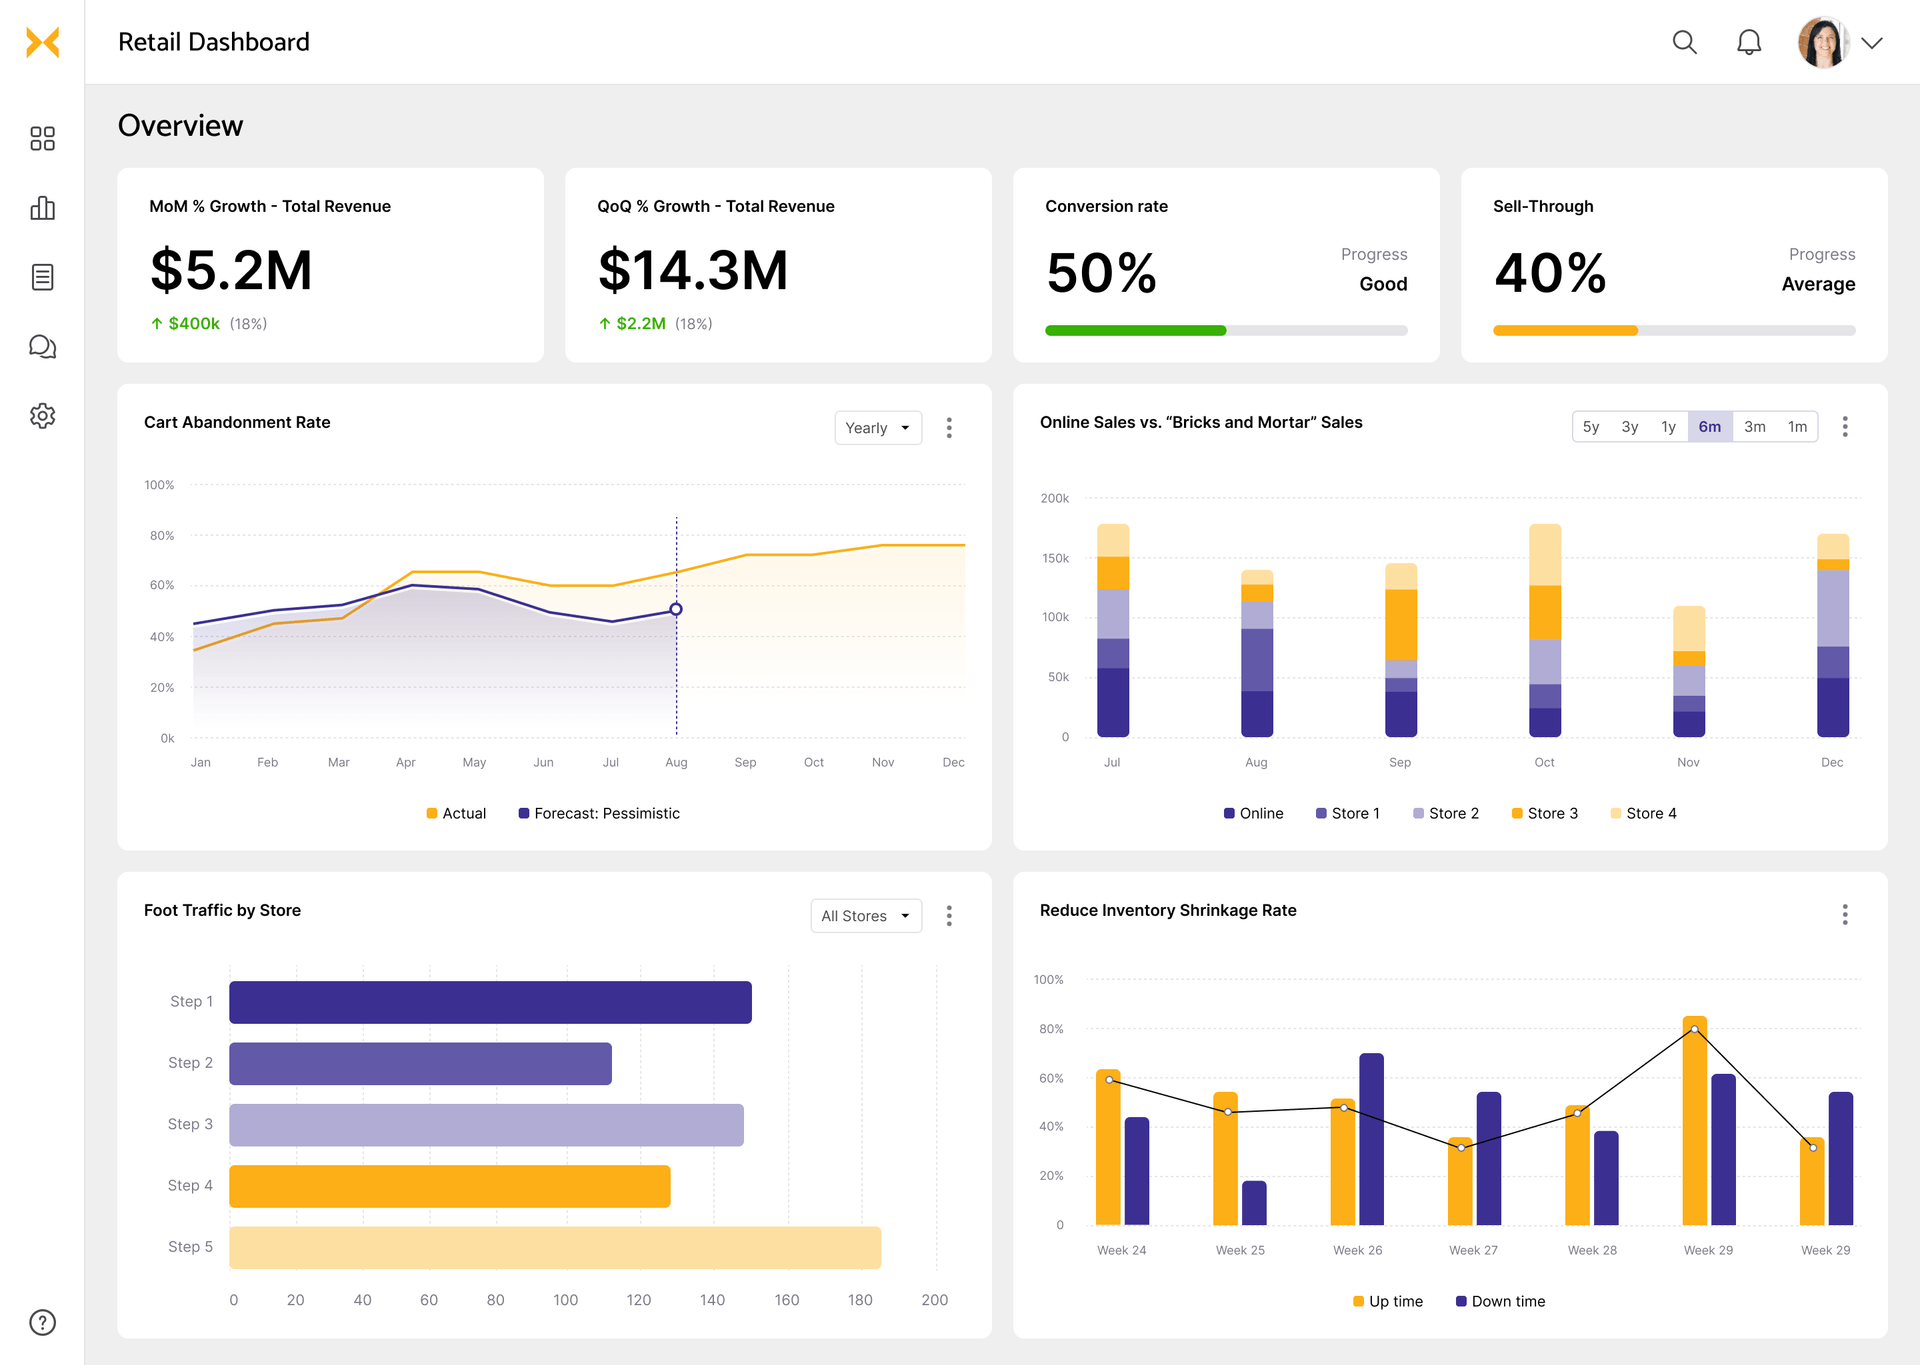
Retail dashboard examples
Monitor your key KPIs in one place - from warehouse stocks to sales to customer feedback