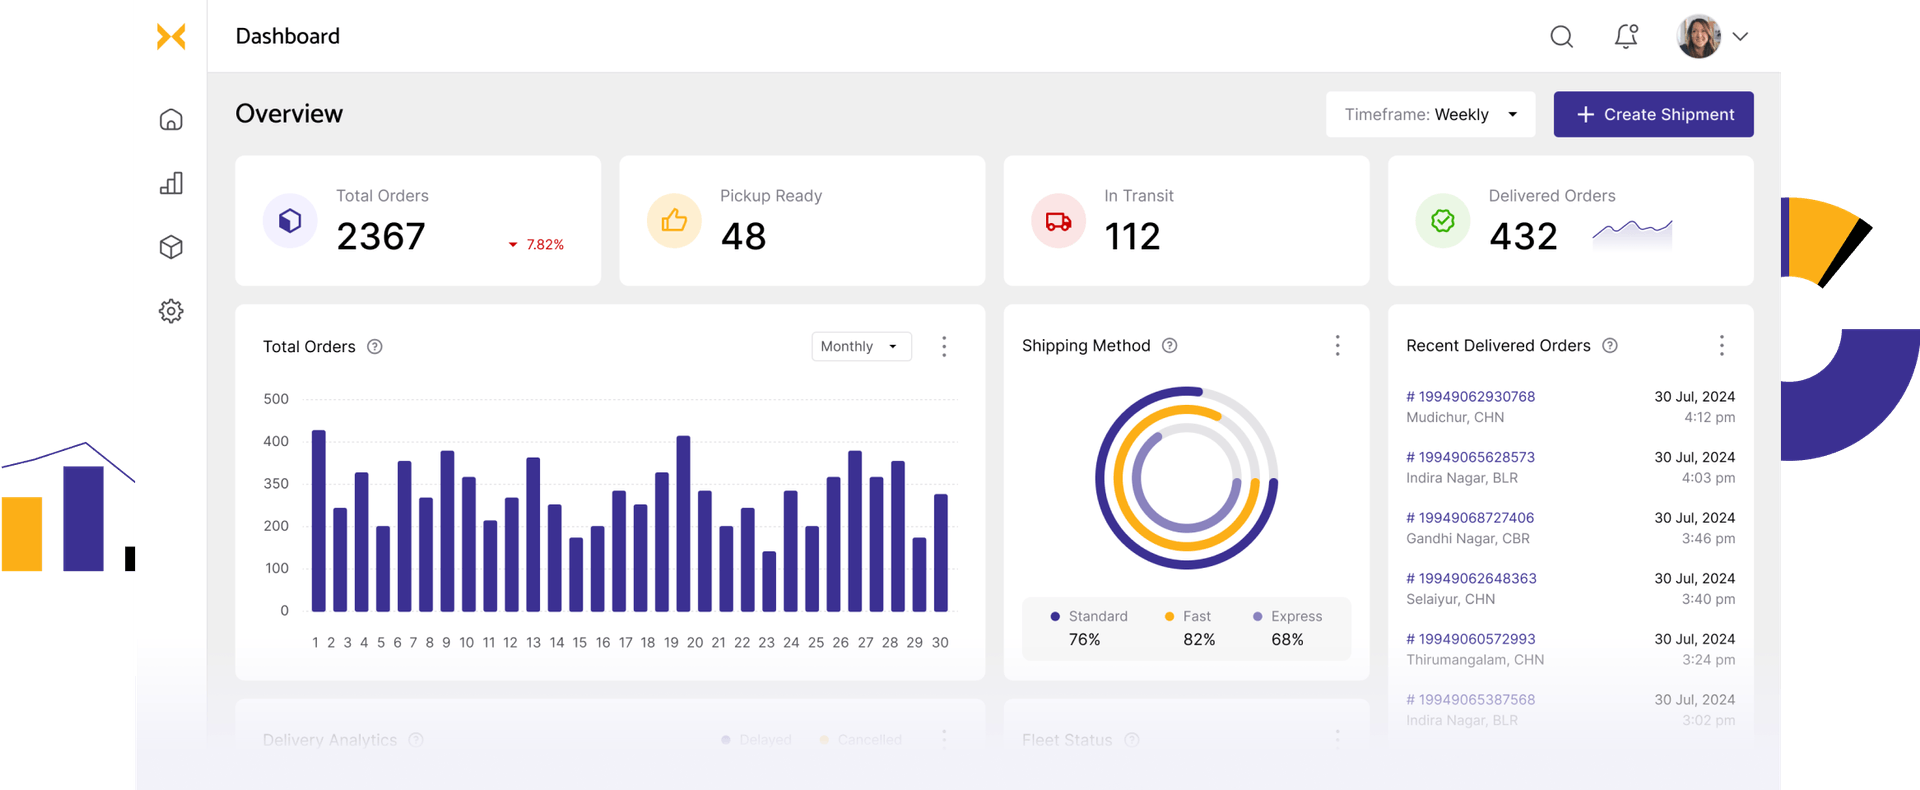

Track what matters for your logistics and supply chain business
Demand changes, high-order intensity ratios, labor shortages, unexpected port congestions, supplier relationships, and changing freight rates. It’s an all-time dynamic playground for logistics businesses. Condense them on one dashboard and monitor how you cope with them all.
Make reporting fun with your customization
14-days no-commitment POC. Schedule a call to initiate yours.
Build my dashboard
It’s all about details. This is what you'll find on your logistics dashboard.


TMS
Fast-track fleets end-to-end
Track your trucks from where you are—number of active trucks, their capacity, cold-chain management, etc, and take the next action right there.
Manpower
See where your labors are beavering away at.
Manage without micromanaging. See the labor % of different sections, identify overallocated and under-allocated units, to re-alter if necessary.
Inbound
Everything about incoming orders
Handle inbound metrics like GRN & putaway, compare orders received to completed, and zero in on in-progress and pending items.
Outbound
Everything about outgoing orders
Watch what your pick and pack speeds are like, track shipped and completed orders, and identify pending items of the day.
Inventory
Max out your inventory storage and utilization
Are you shelving and racking purposefully? Track your storage and utilization rate in trench levels here. An input crucial to make your putaway more efficient.
Types of dashboards for your different business needs
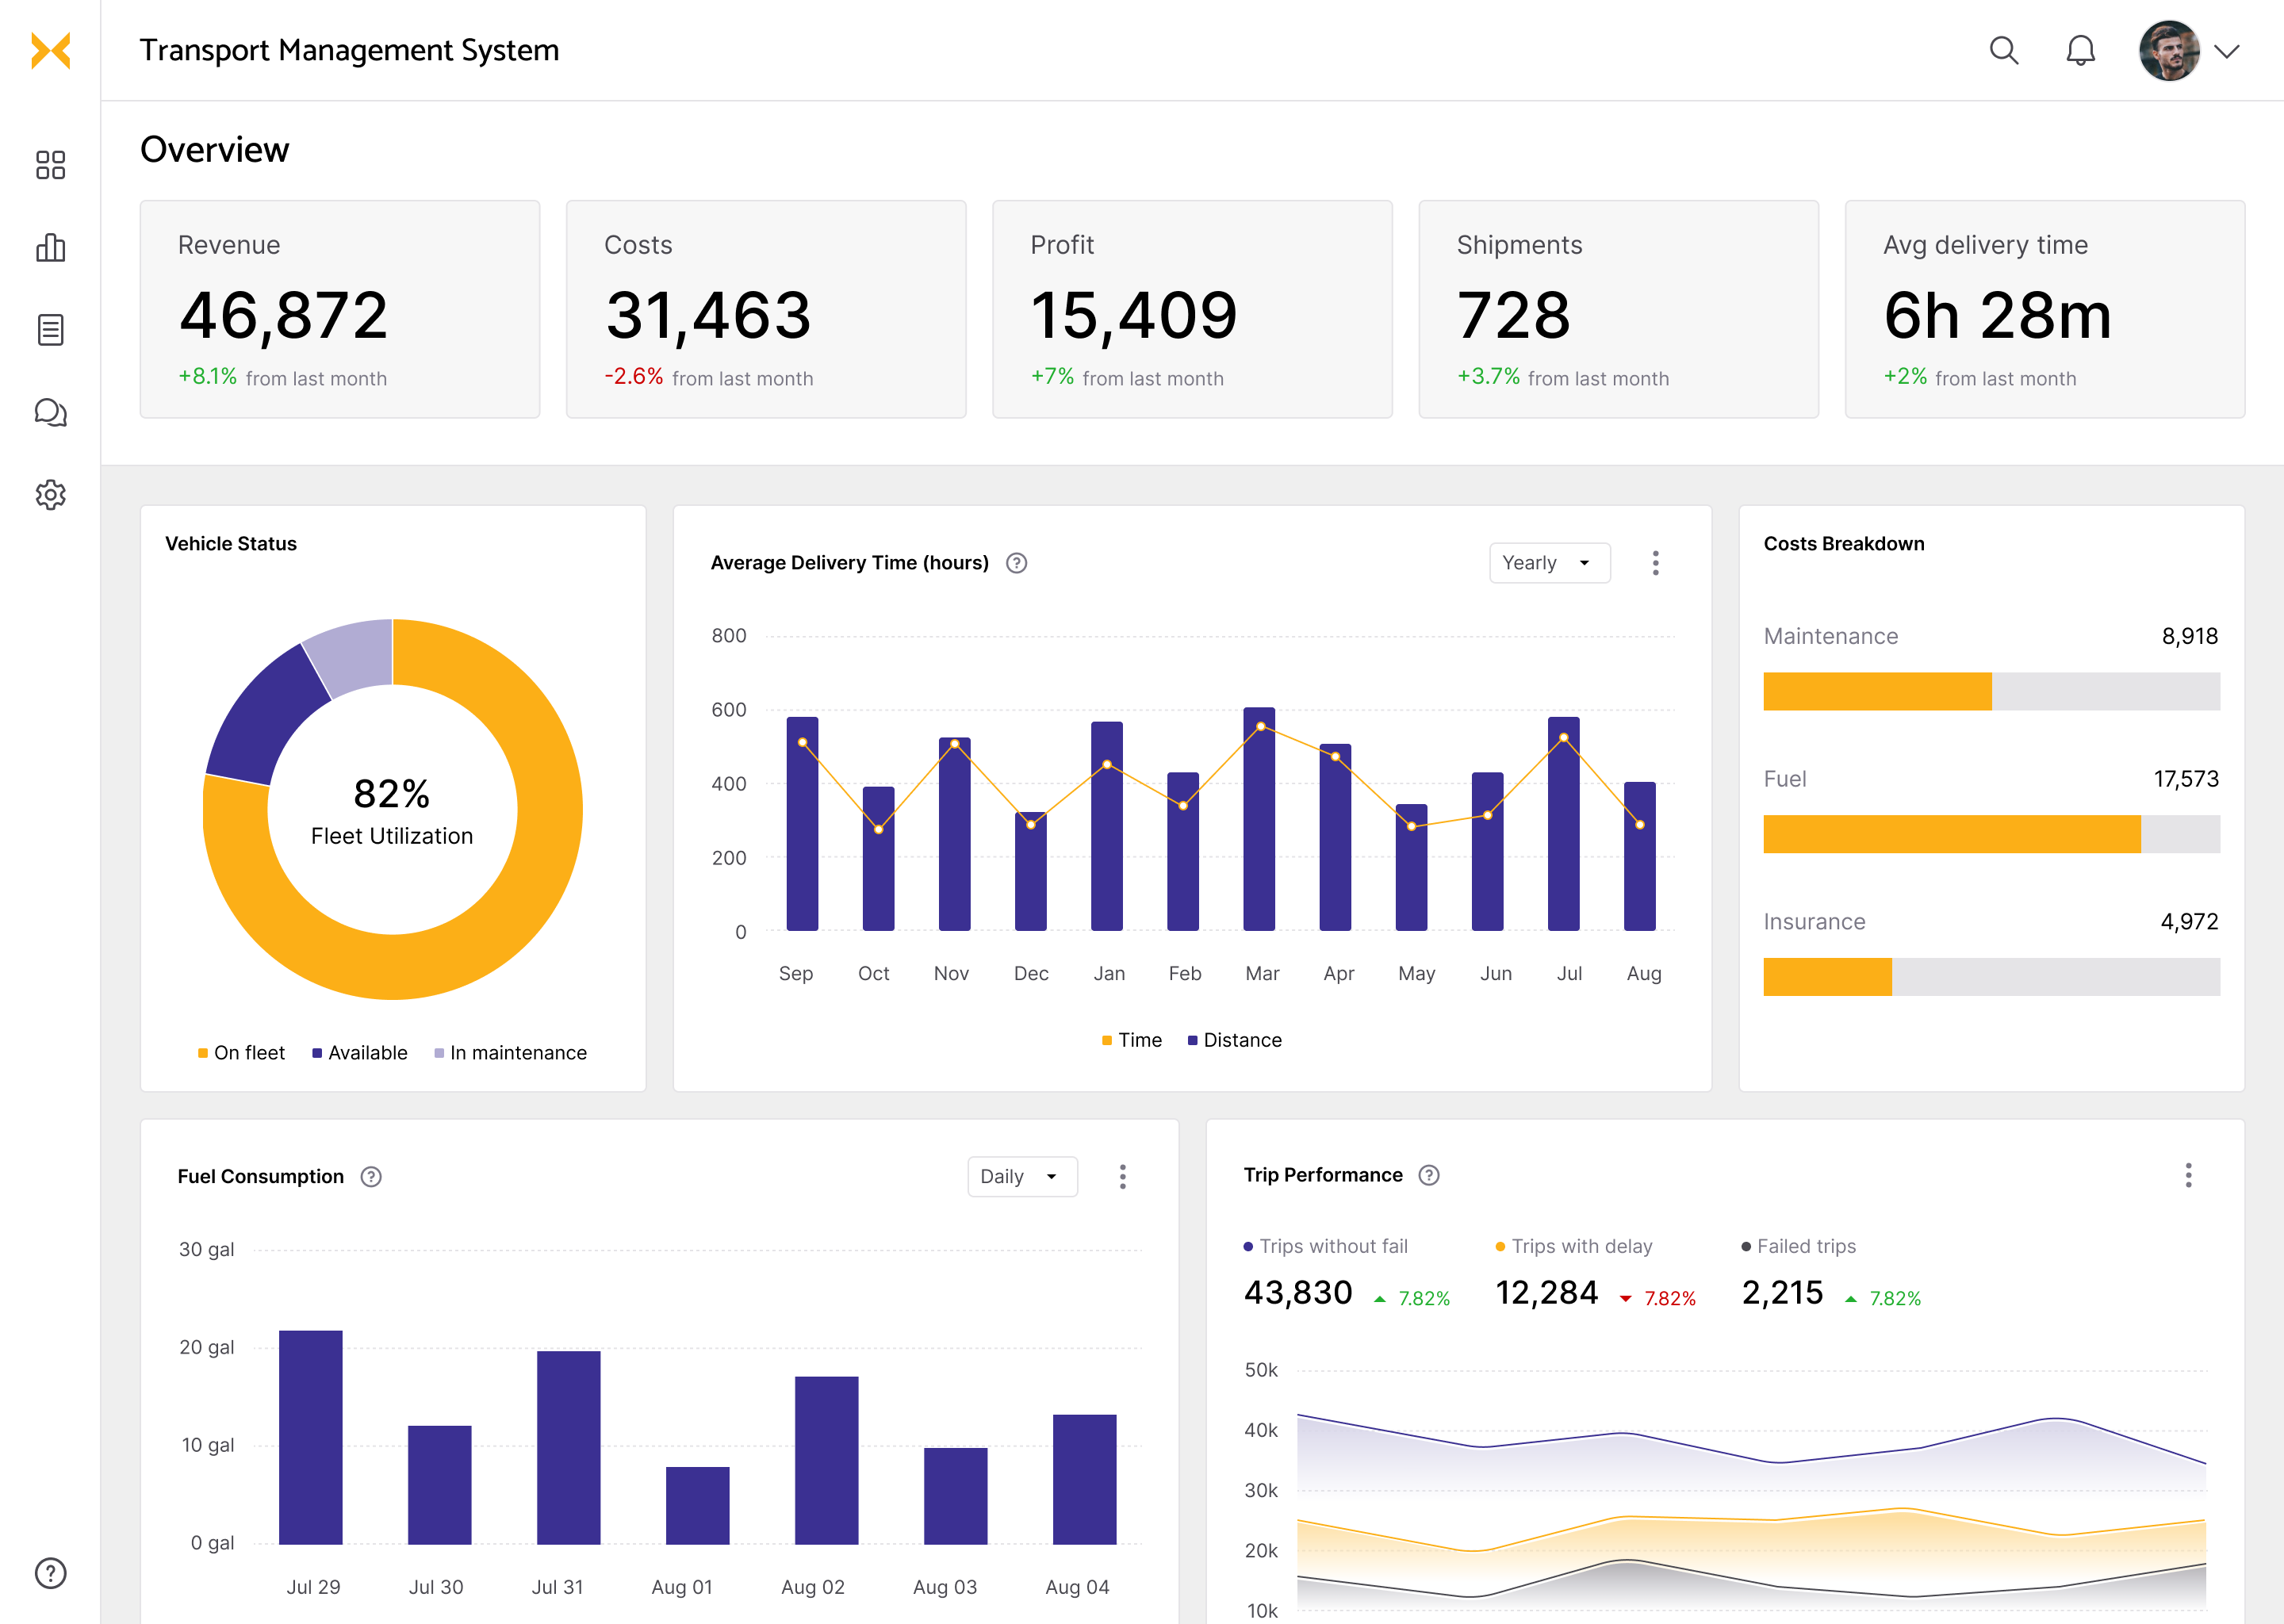
Transport management dashboard
All roads don’t lead to Rome for fleet managers. Their operations and strategies should be well-planned. An exclusive TMS dashboard can help with accurate equipment tracking, freight claims, delivery times, transit times, billing, etc.
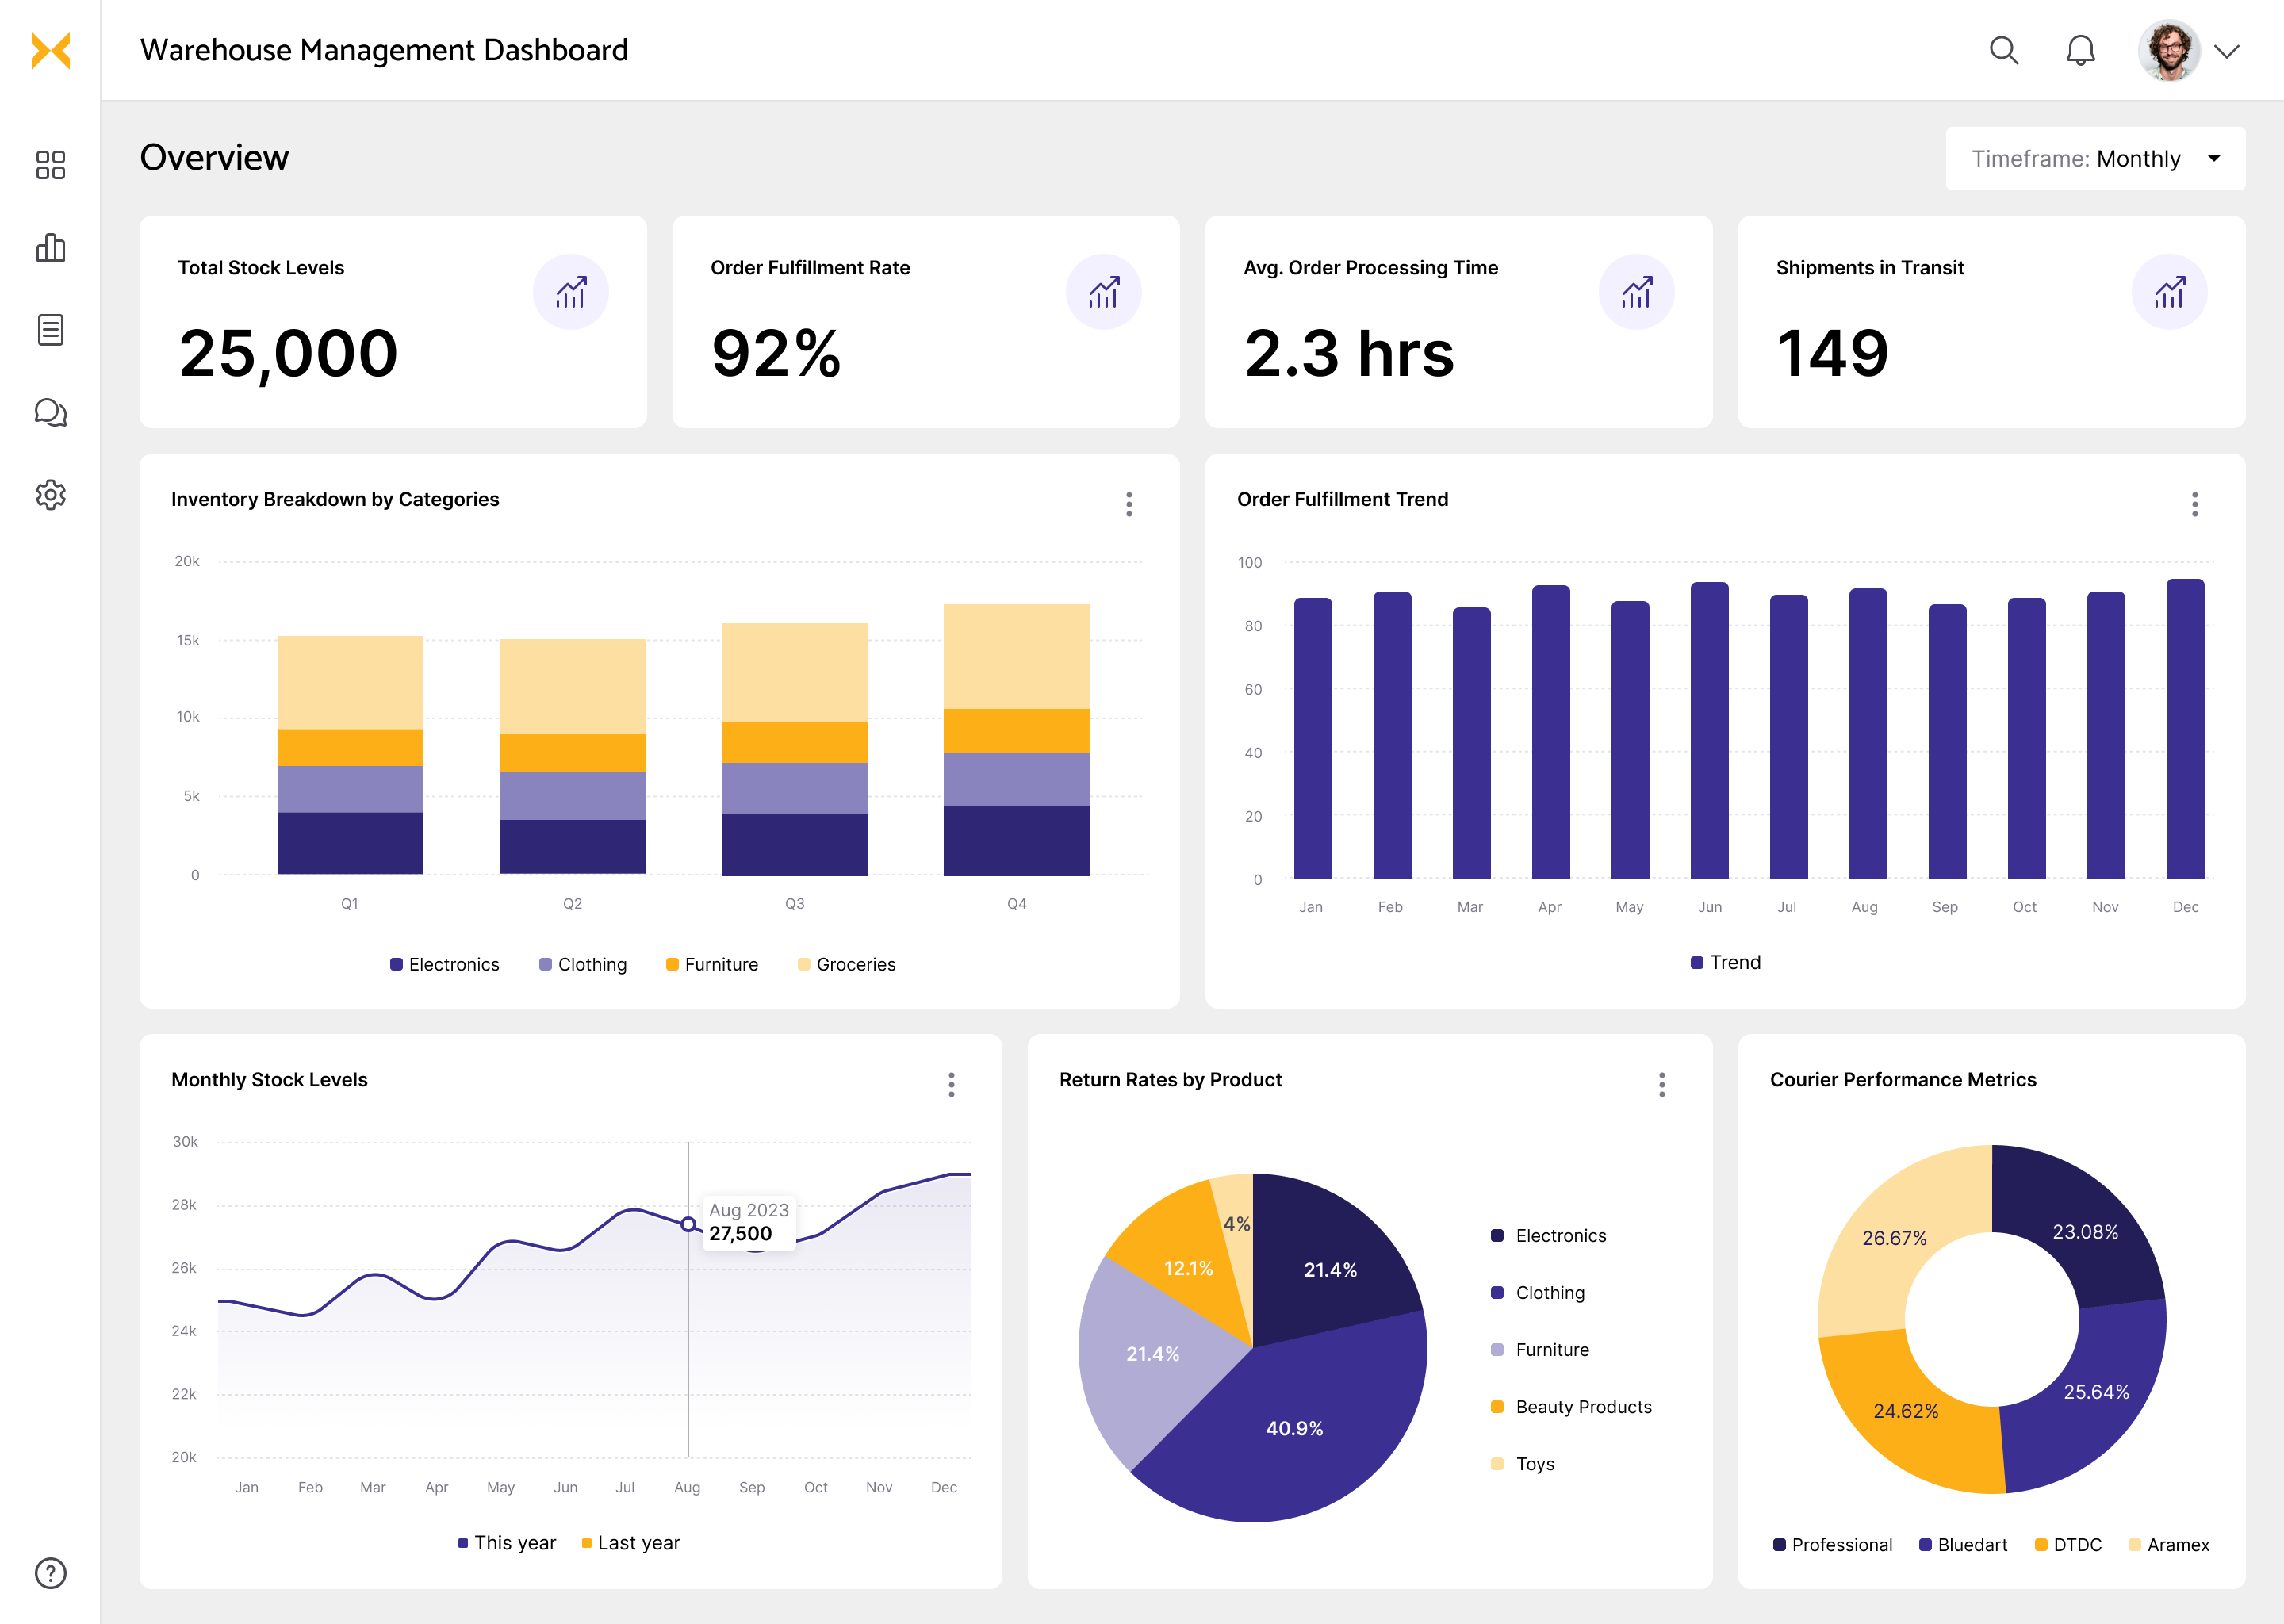
Warehouse management dashboard
Warehouse managers juggle a lot—warehouse inspections, labeling, labor assignment, equipment control, and a lot others. A WMS dashboard is what they need to soak up updates from all areas without leaving the desk.
Why datakulture?
Why datakulture?
10+
Years of experience
50+
Projects delivered
20+
Certified data & BI consultants
96%
Satisfactory customers

Dashboard by roles
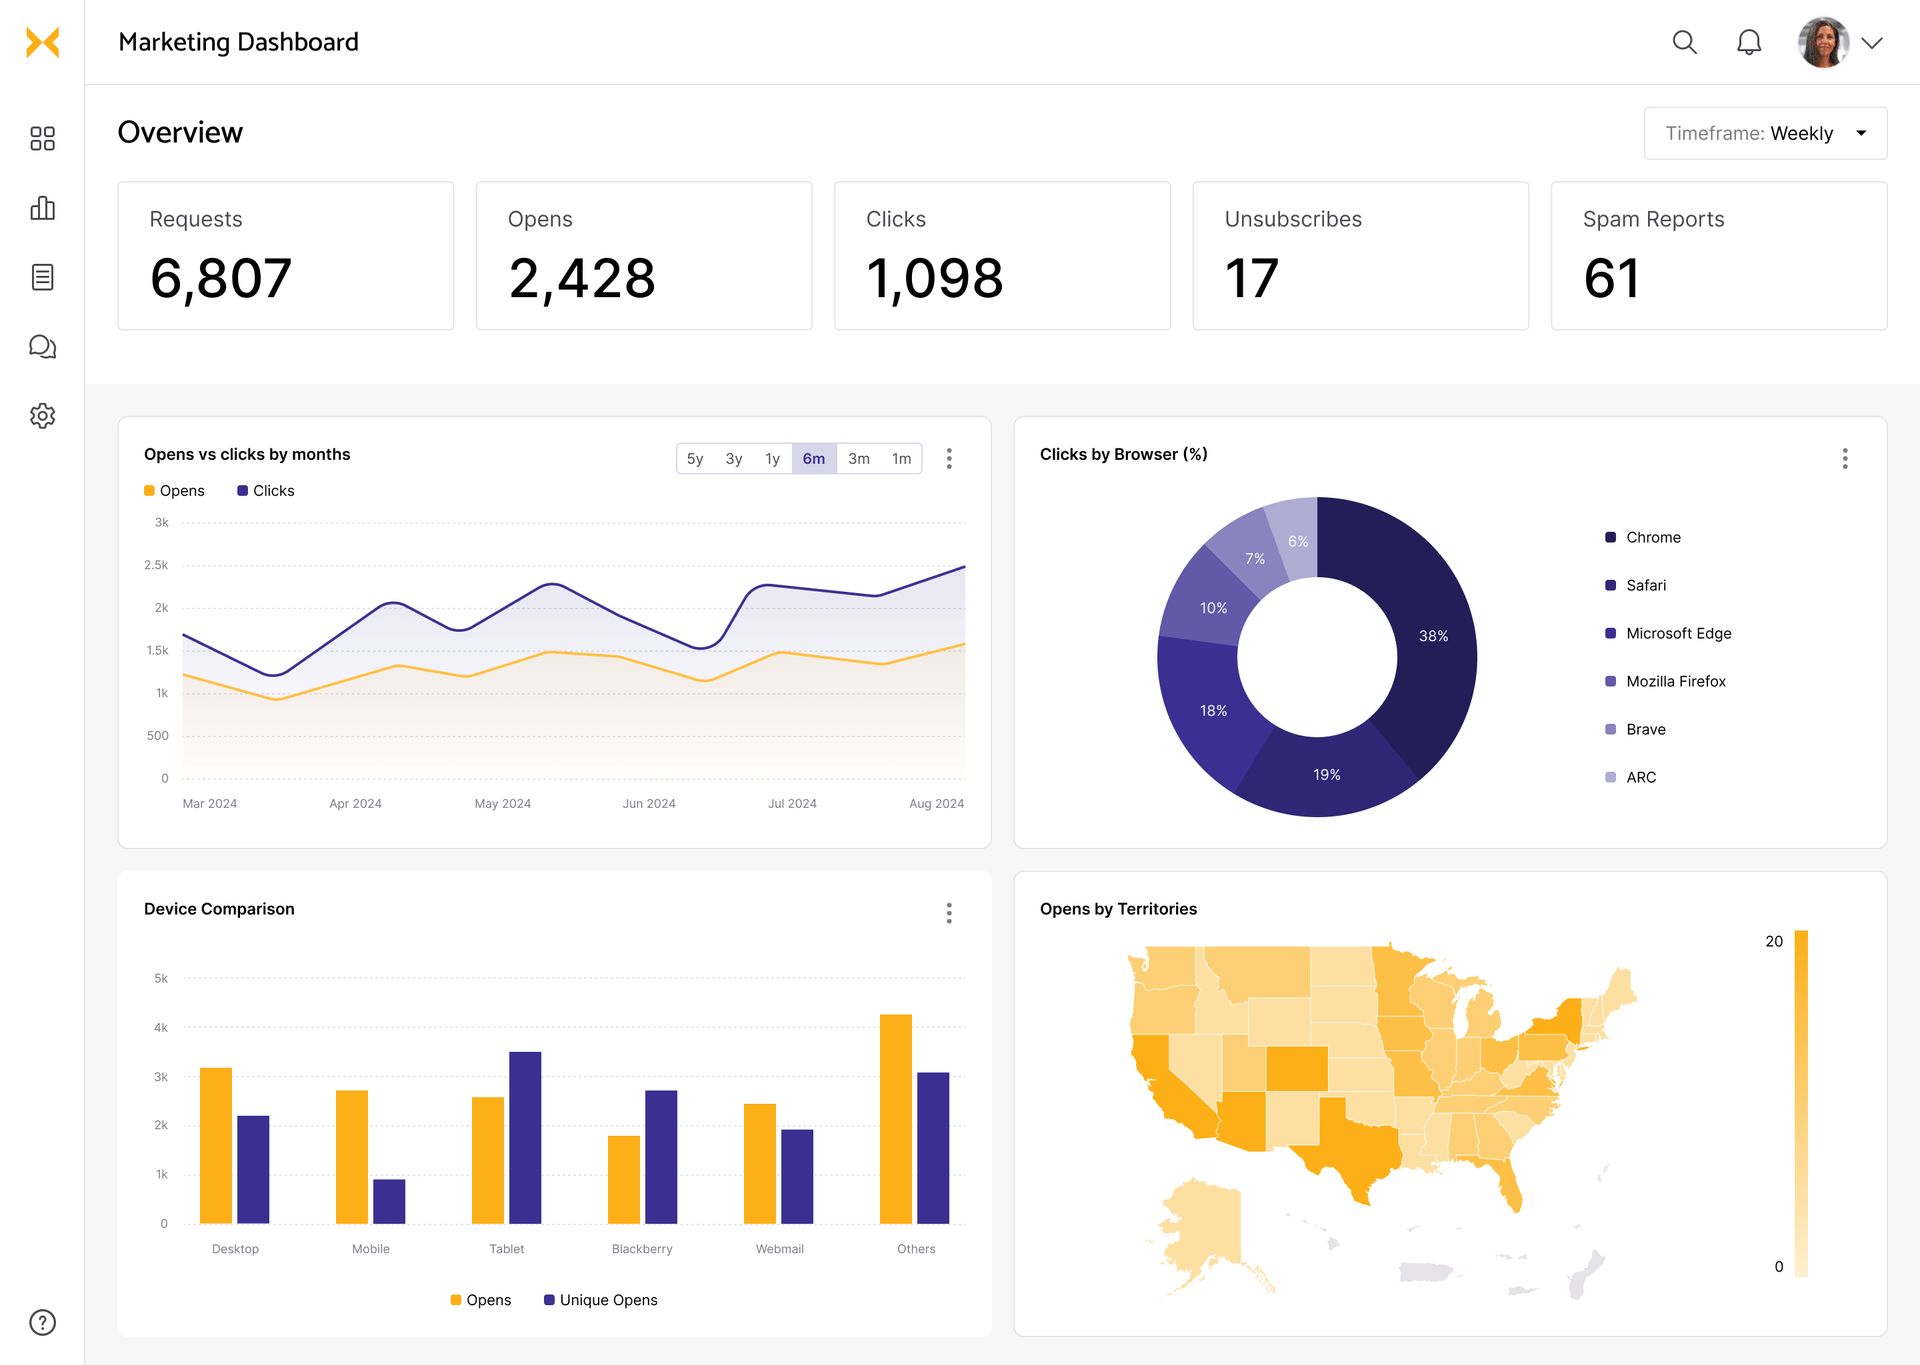
Marketing dashboard examples
ROI to socials to growth - made to suit both matured marketing teams, one person marketers, and agencies.
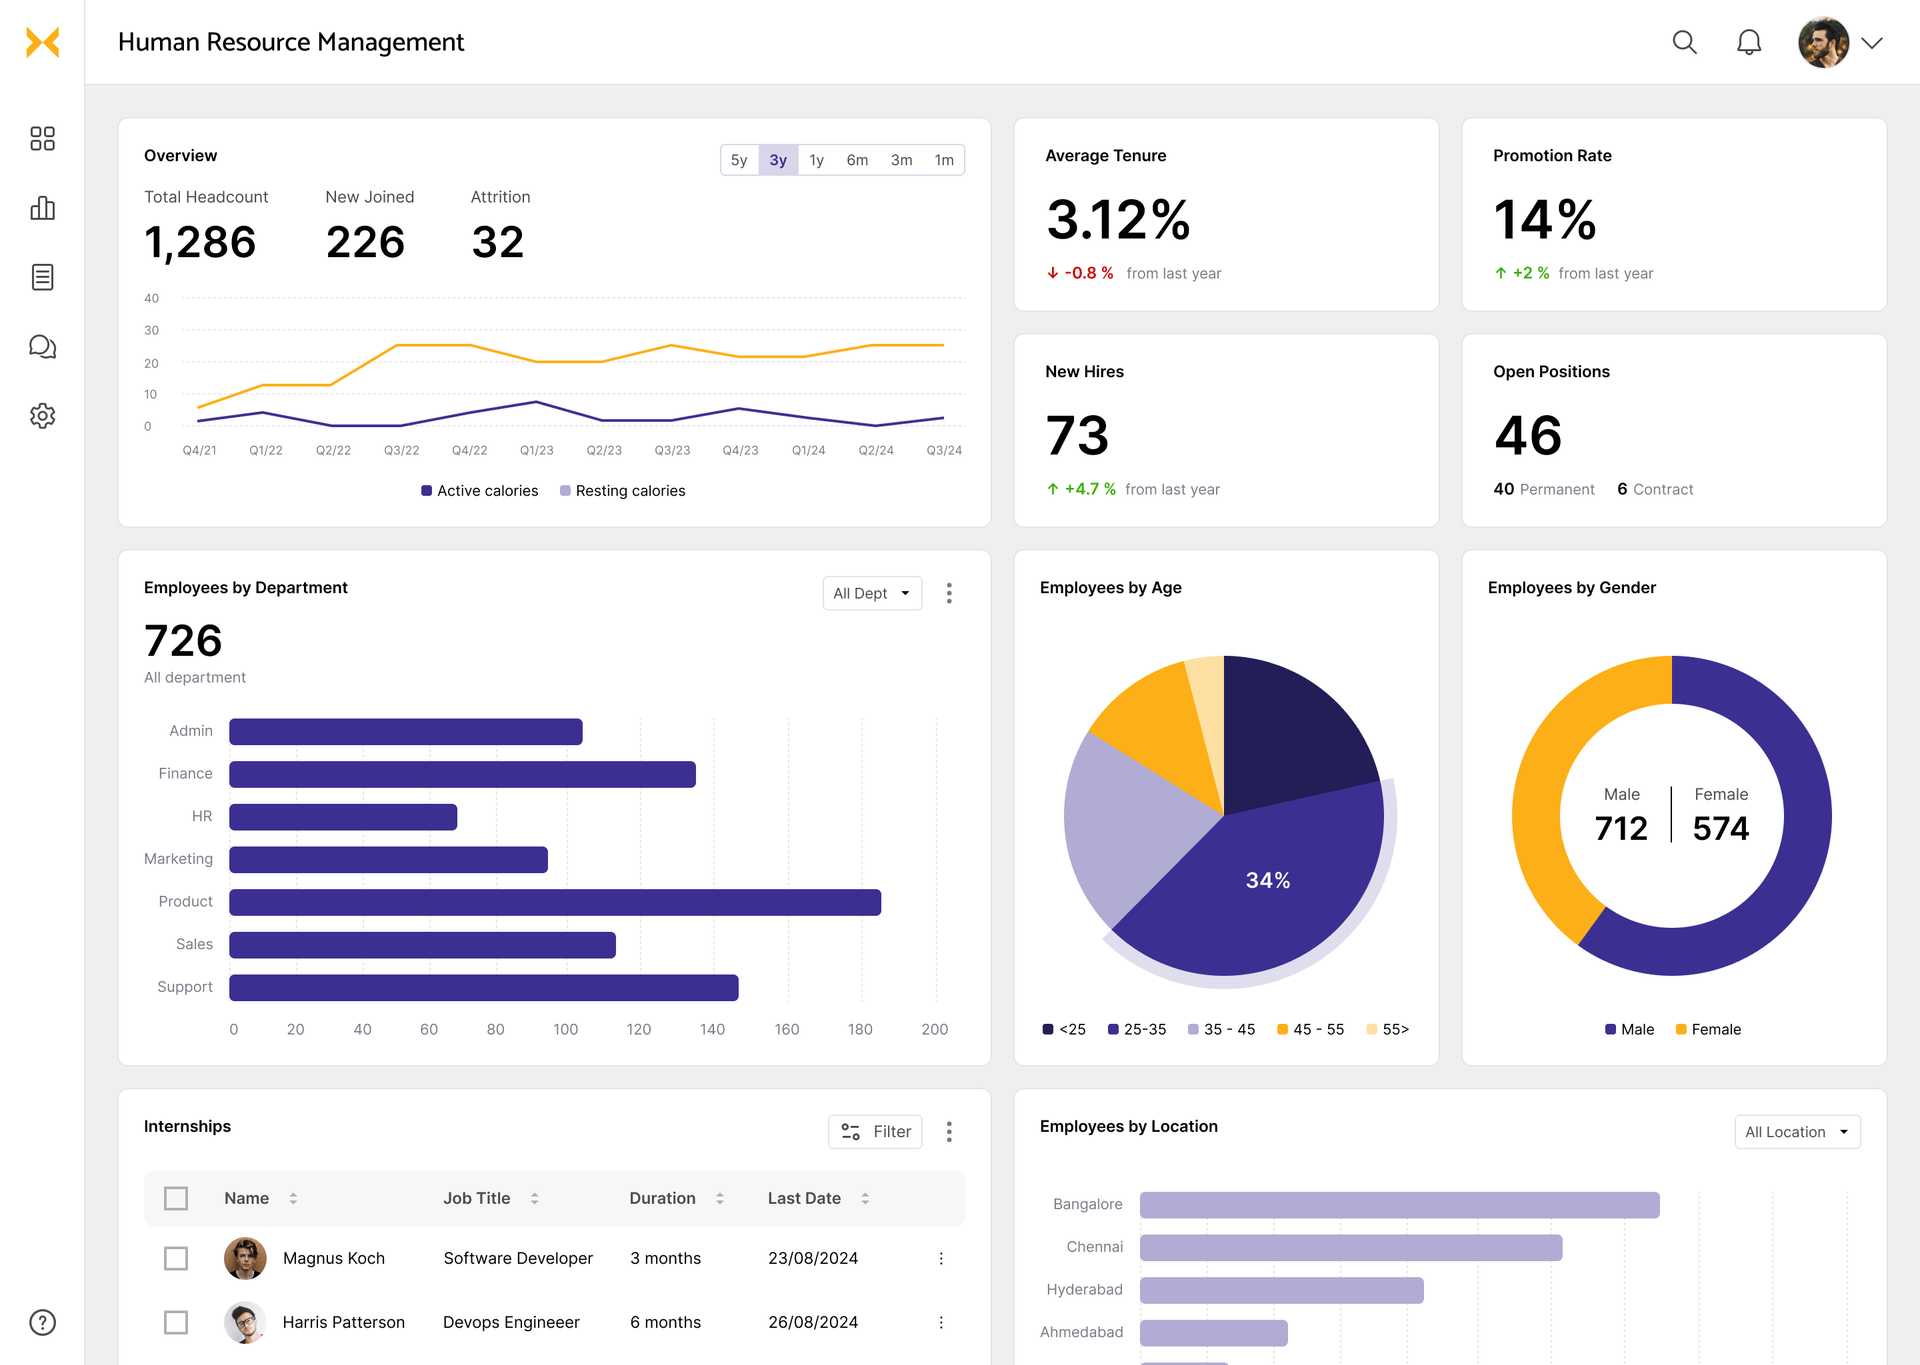
HR dashboard examples
Catch up on what’s happening in your company - from talent management to hiring to productivity
Dashboard by industry
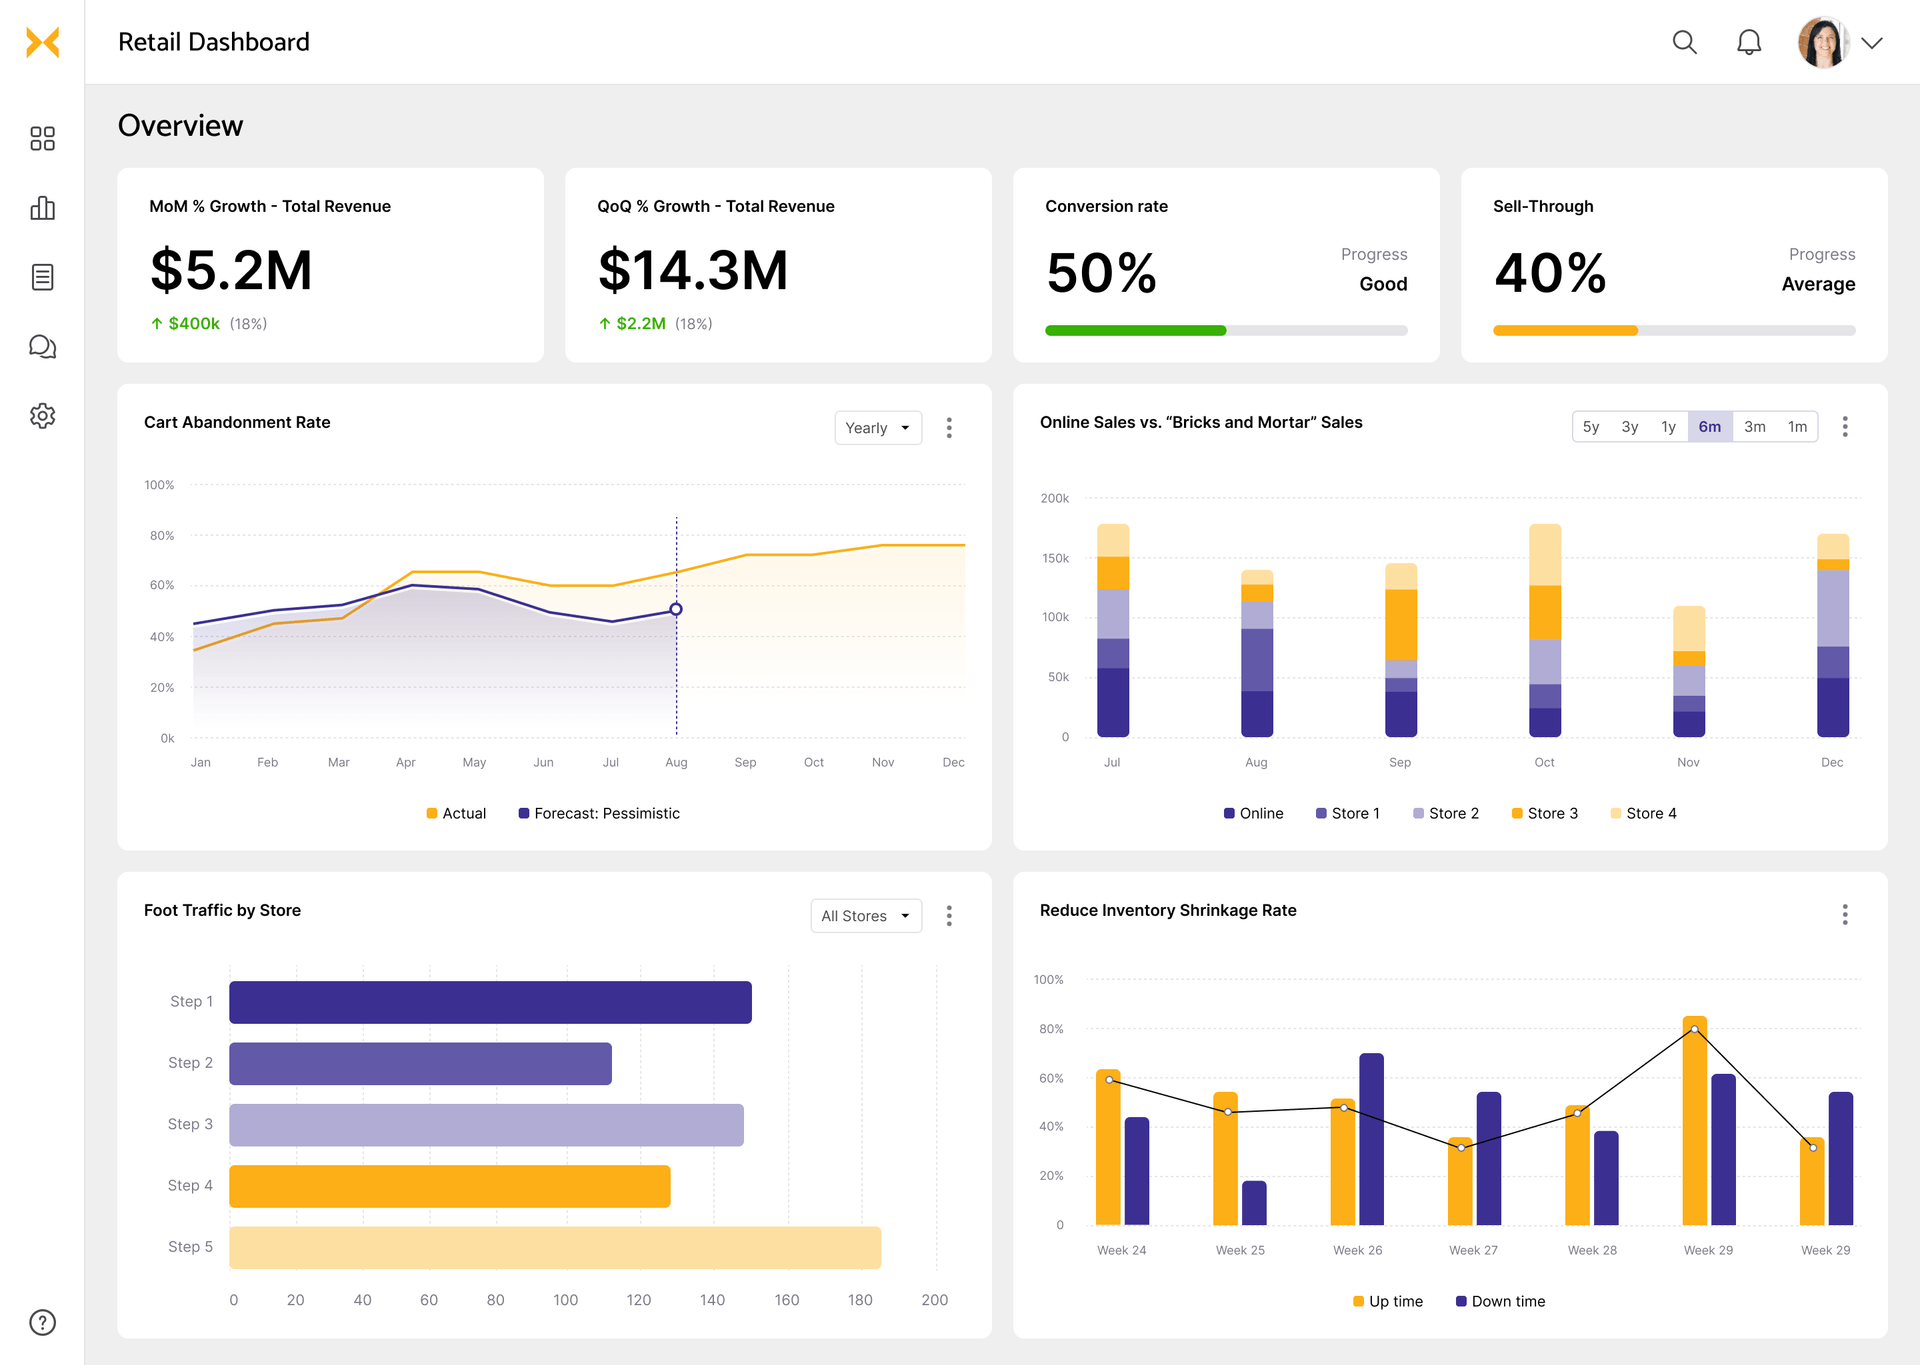
Retail dashboard examples
Monitor your key KPIs in one place - from warehouse stocks to sales to customer feedback
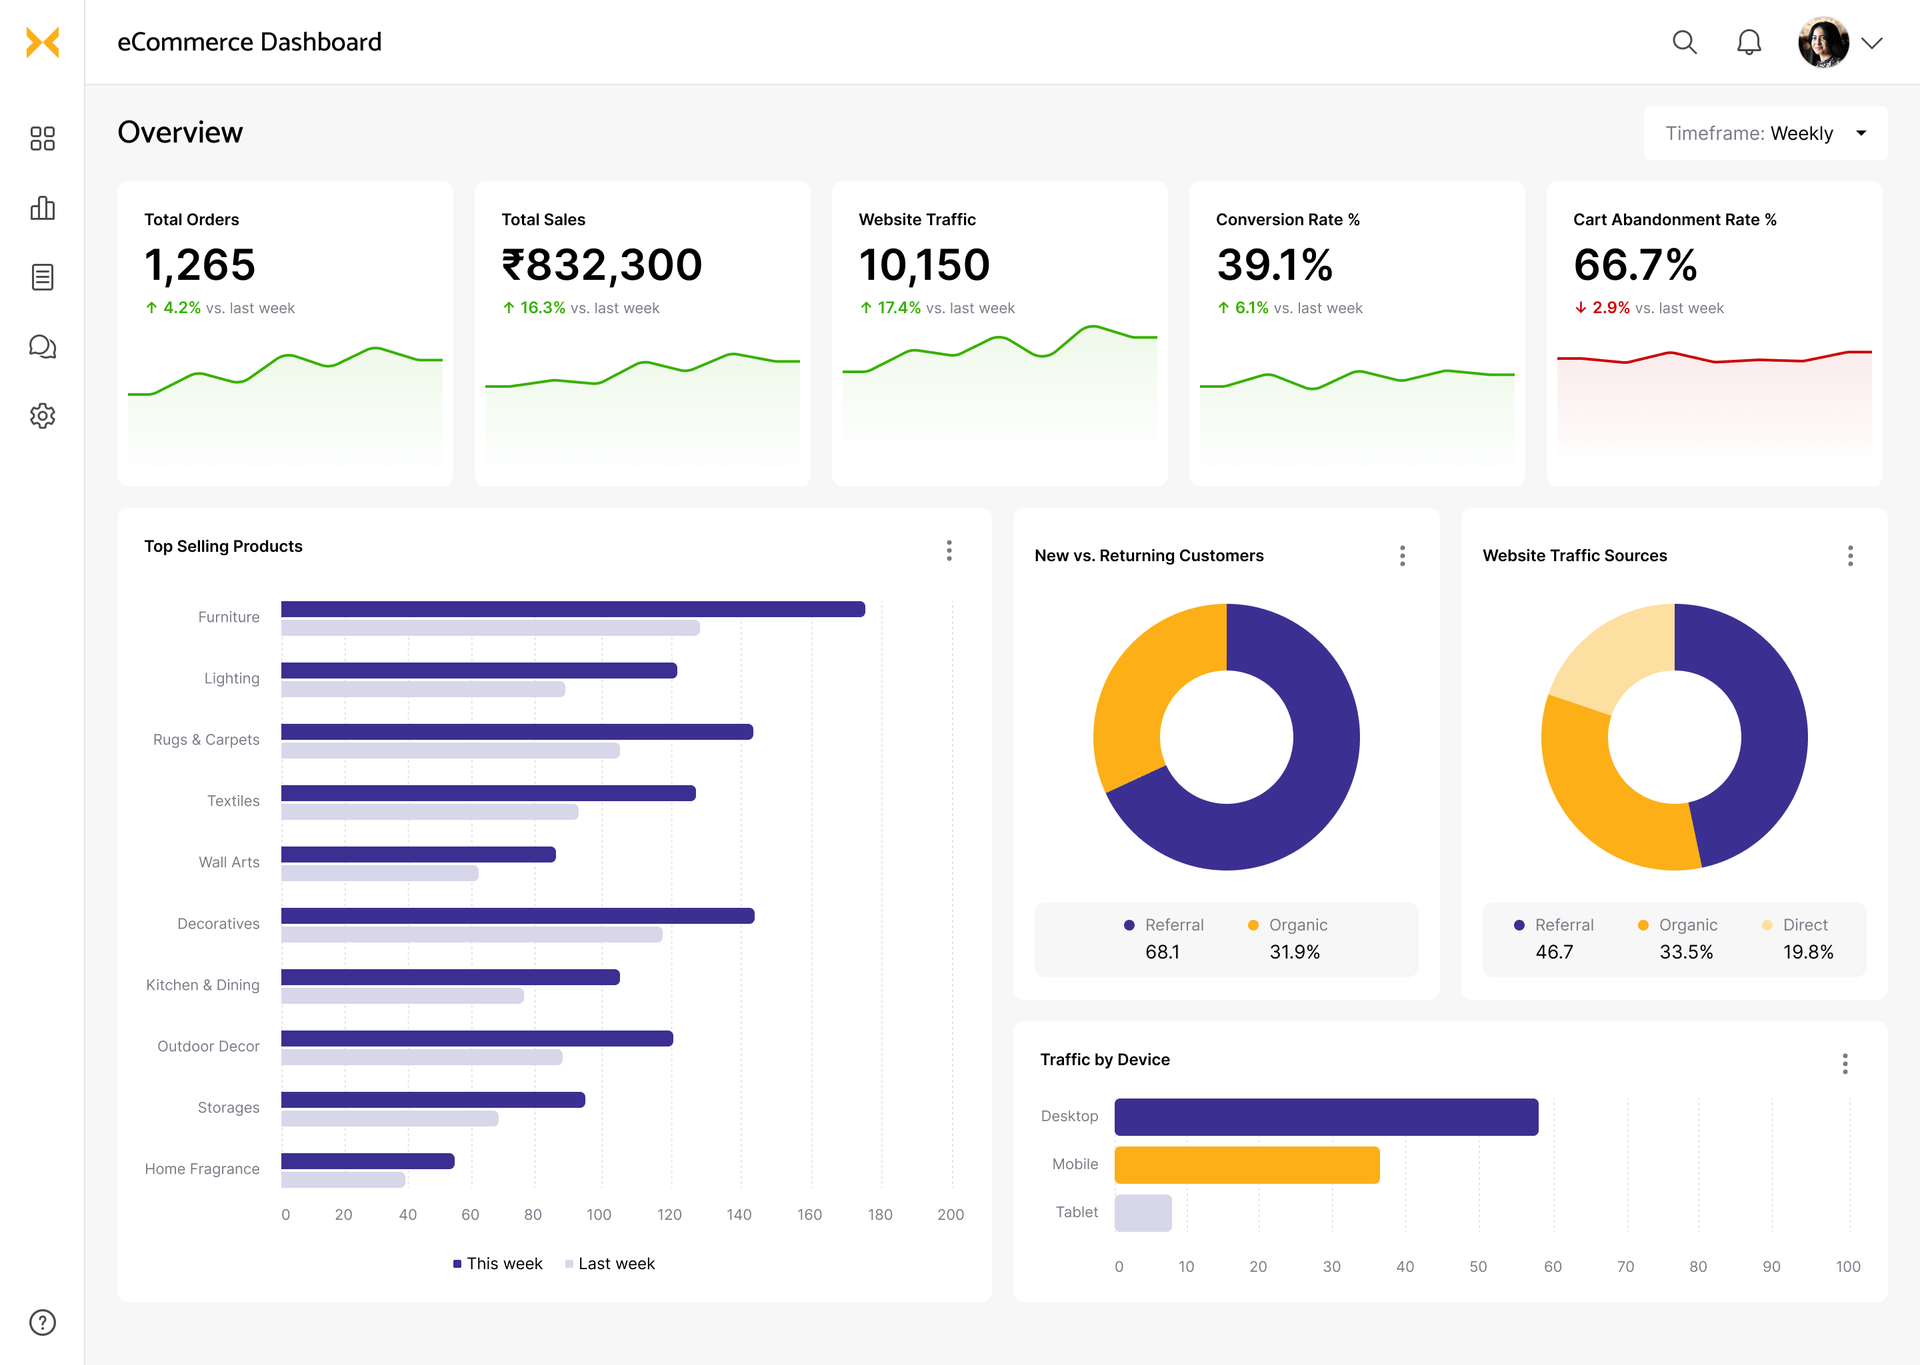
eCommerce dashboard examples
The one-stop data shop of an online shop—top selling products, revenue, region-wise traffic, conversion, and the whole shebang. More elaborate than what you can find in your monthly analytics reports.
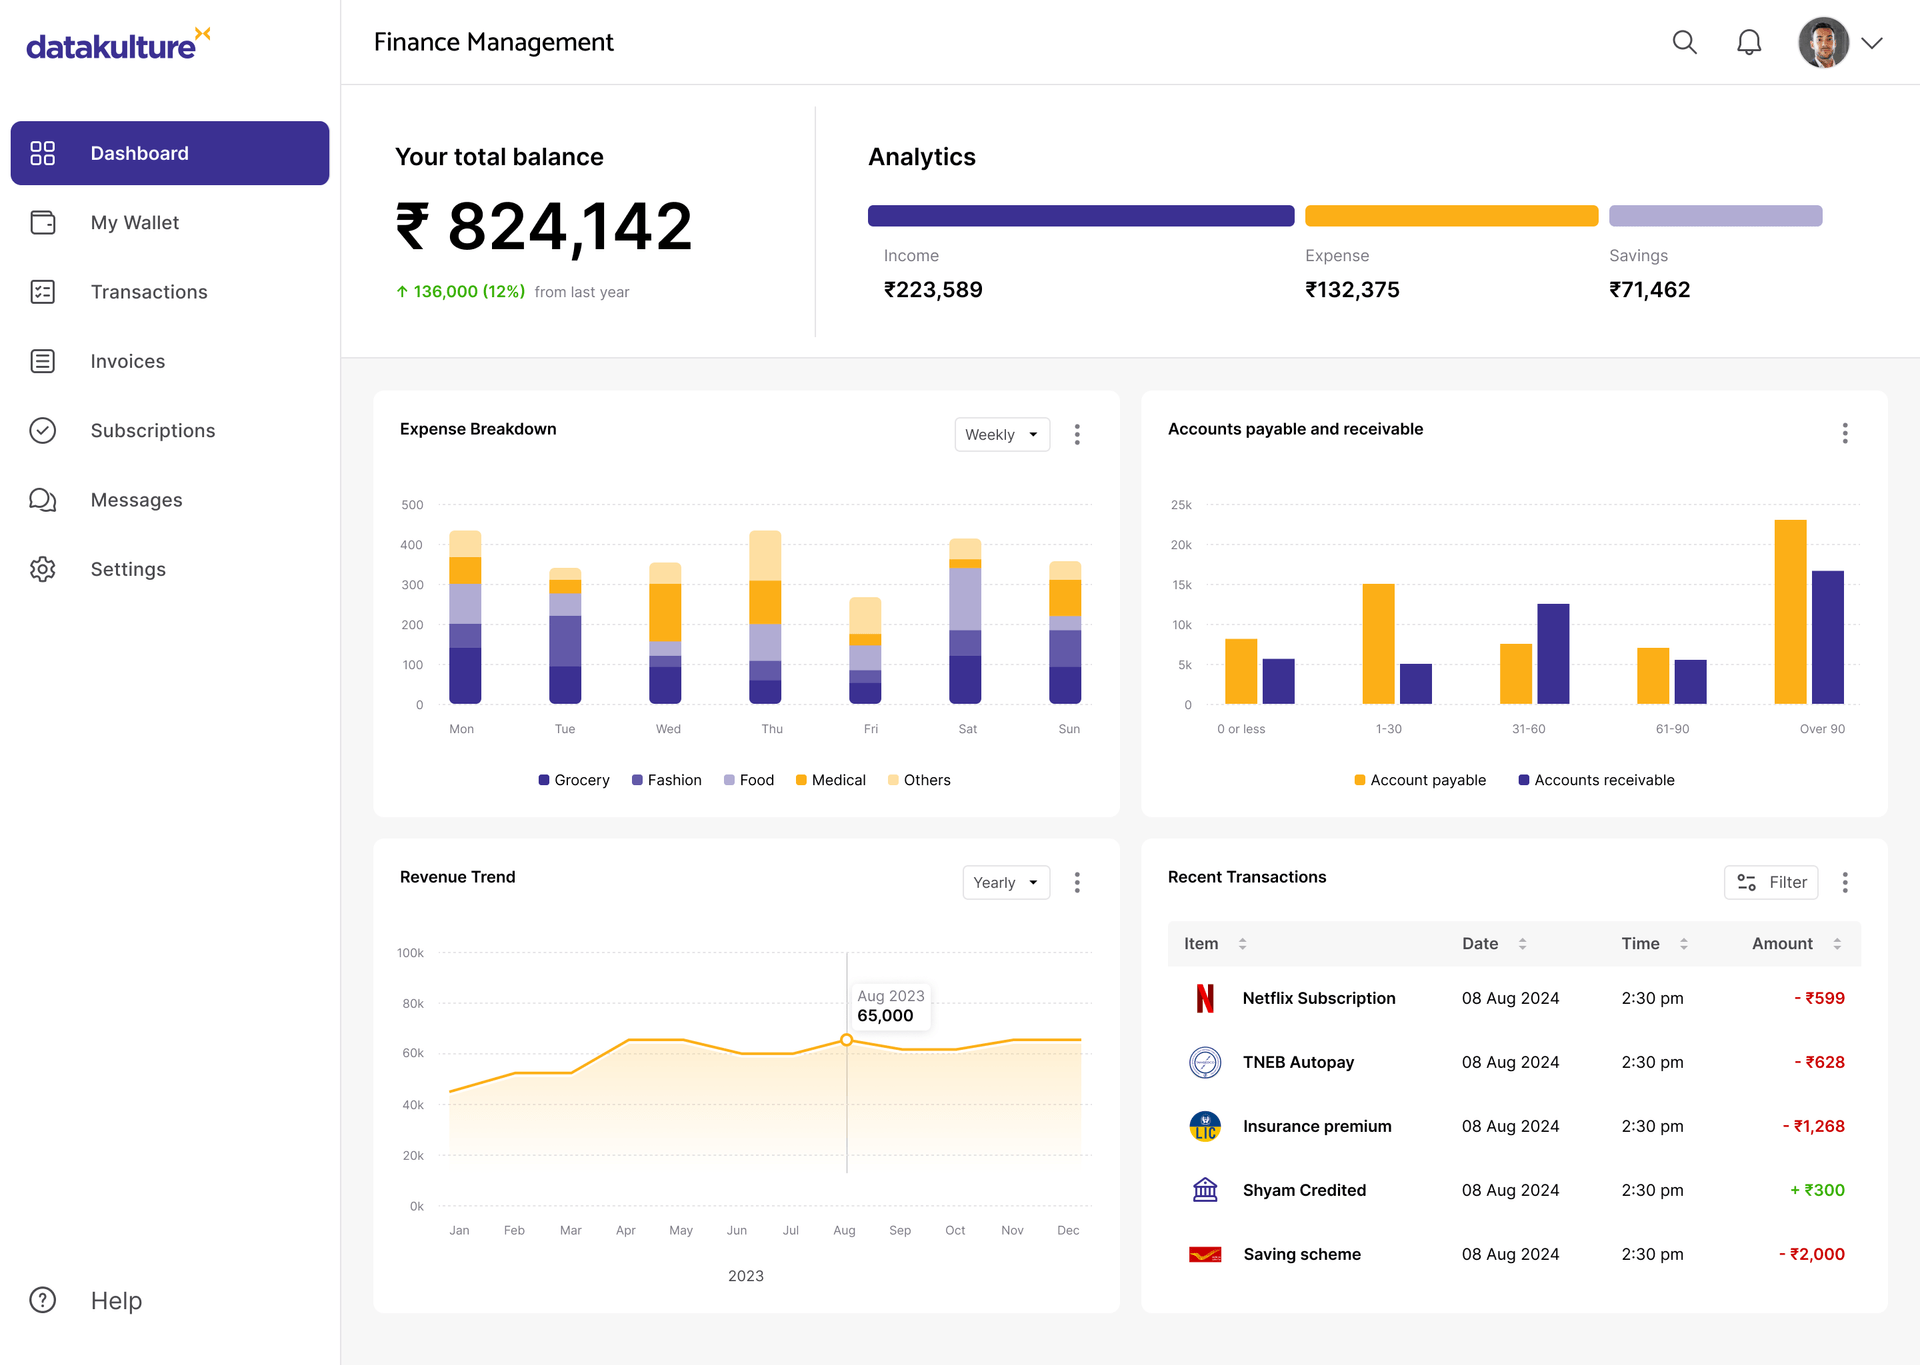
Finance dashboard examples
The window to your business wallet is here. Get a quick peek into your spending, income, top spends, etc., on a tap, visualized to your liking