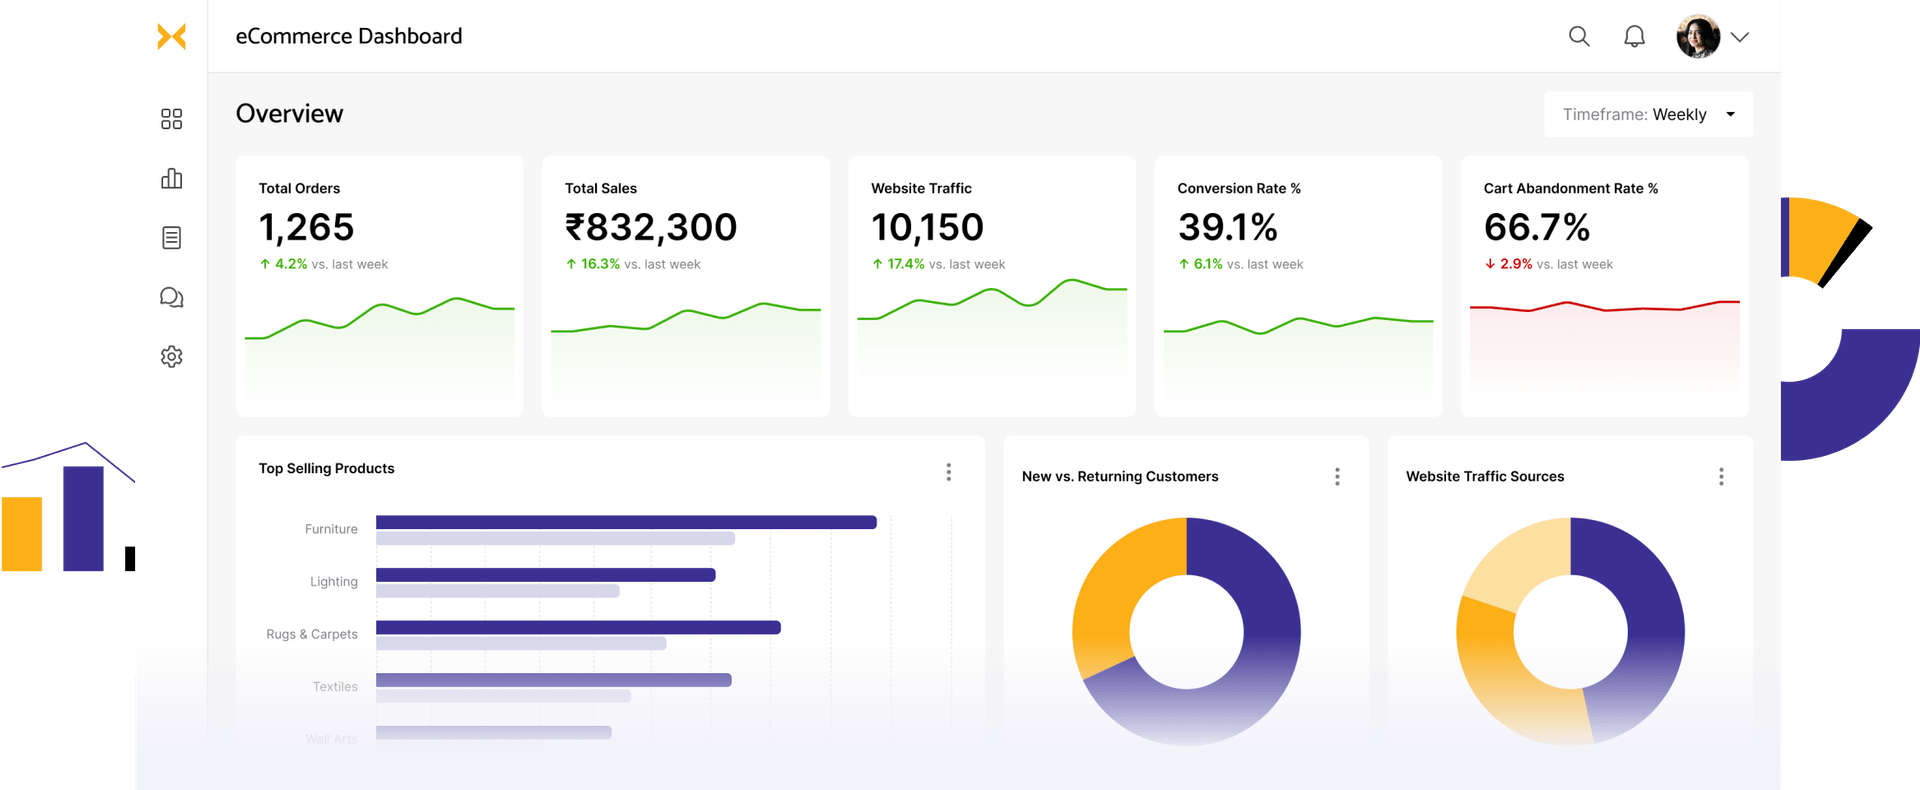

Your eCommerce dashboard, customized your way. Track only what's needed
From current sales to conversion rates to cart abandonments, this is the virtual assistant you need to know what’s up with your digital marketplace. Track, compare, and take action—all in the same place. Optimized to suit fast-paced needs of the industry.
An insights store for your eCommerce store
14-days no-commitment POC. Schedule a call to initiate yours.
Build my dashboard
It’s all about details. This is what you'll find on your eCommerce dashboard.


Visitor stats
Segments of customers who visited your digital shop - new, old, repeat, and others.
Drill down into customer details by region, type, purchase/cart value, gender, and all the specifics.
Conversion rates
Visitor to buyer trends from time to time
Analyze conversion rates and compare with past periods. See future projections to plan marketing activities.
Bestsellers
List of top-selling products & their details
Know what’s trending at the moment with the section displaying top 10 products, purchases, sale value, etc., more than what your eCommerce site tells you.
Sales and transactions
Total orders, sale value, top transactions, and projected revenue
Find quick stats on total orders and its growth over time, with detailed comparison charts, plotting quantities of each day of the entire week.
Campaign performance & ROI
Website traction from ads & related conversions
Get a visual summary of your ad performance and ROI - clicks, conversions, and everything in between.
Types of dashboards for your different business needs
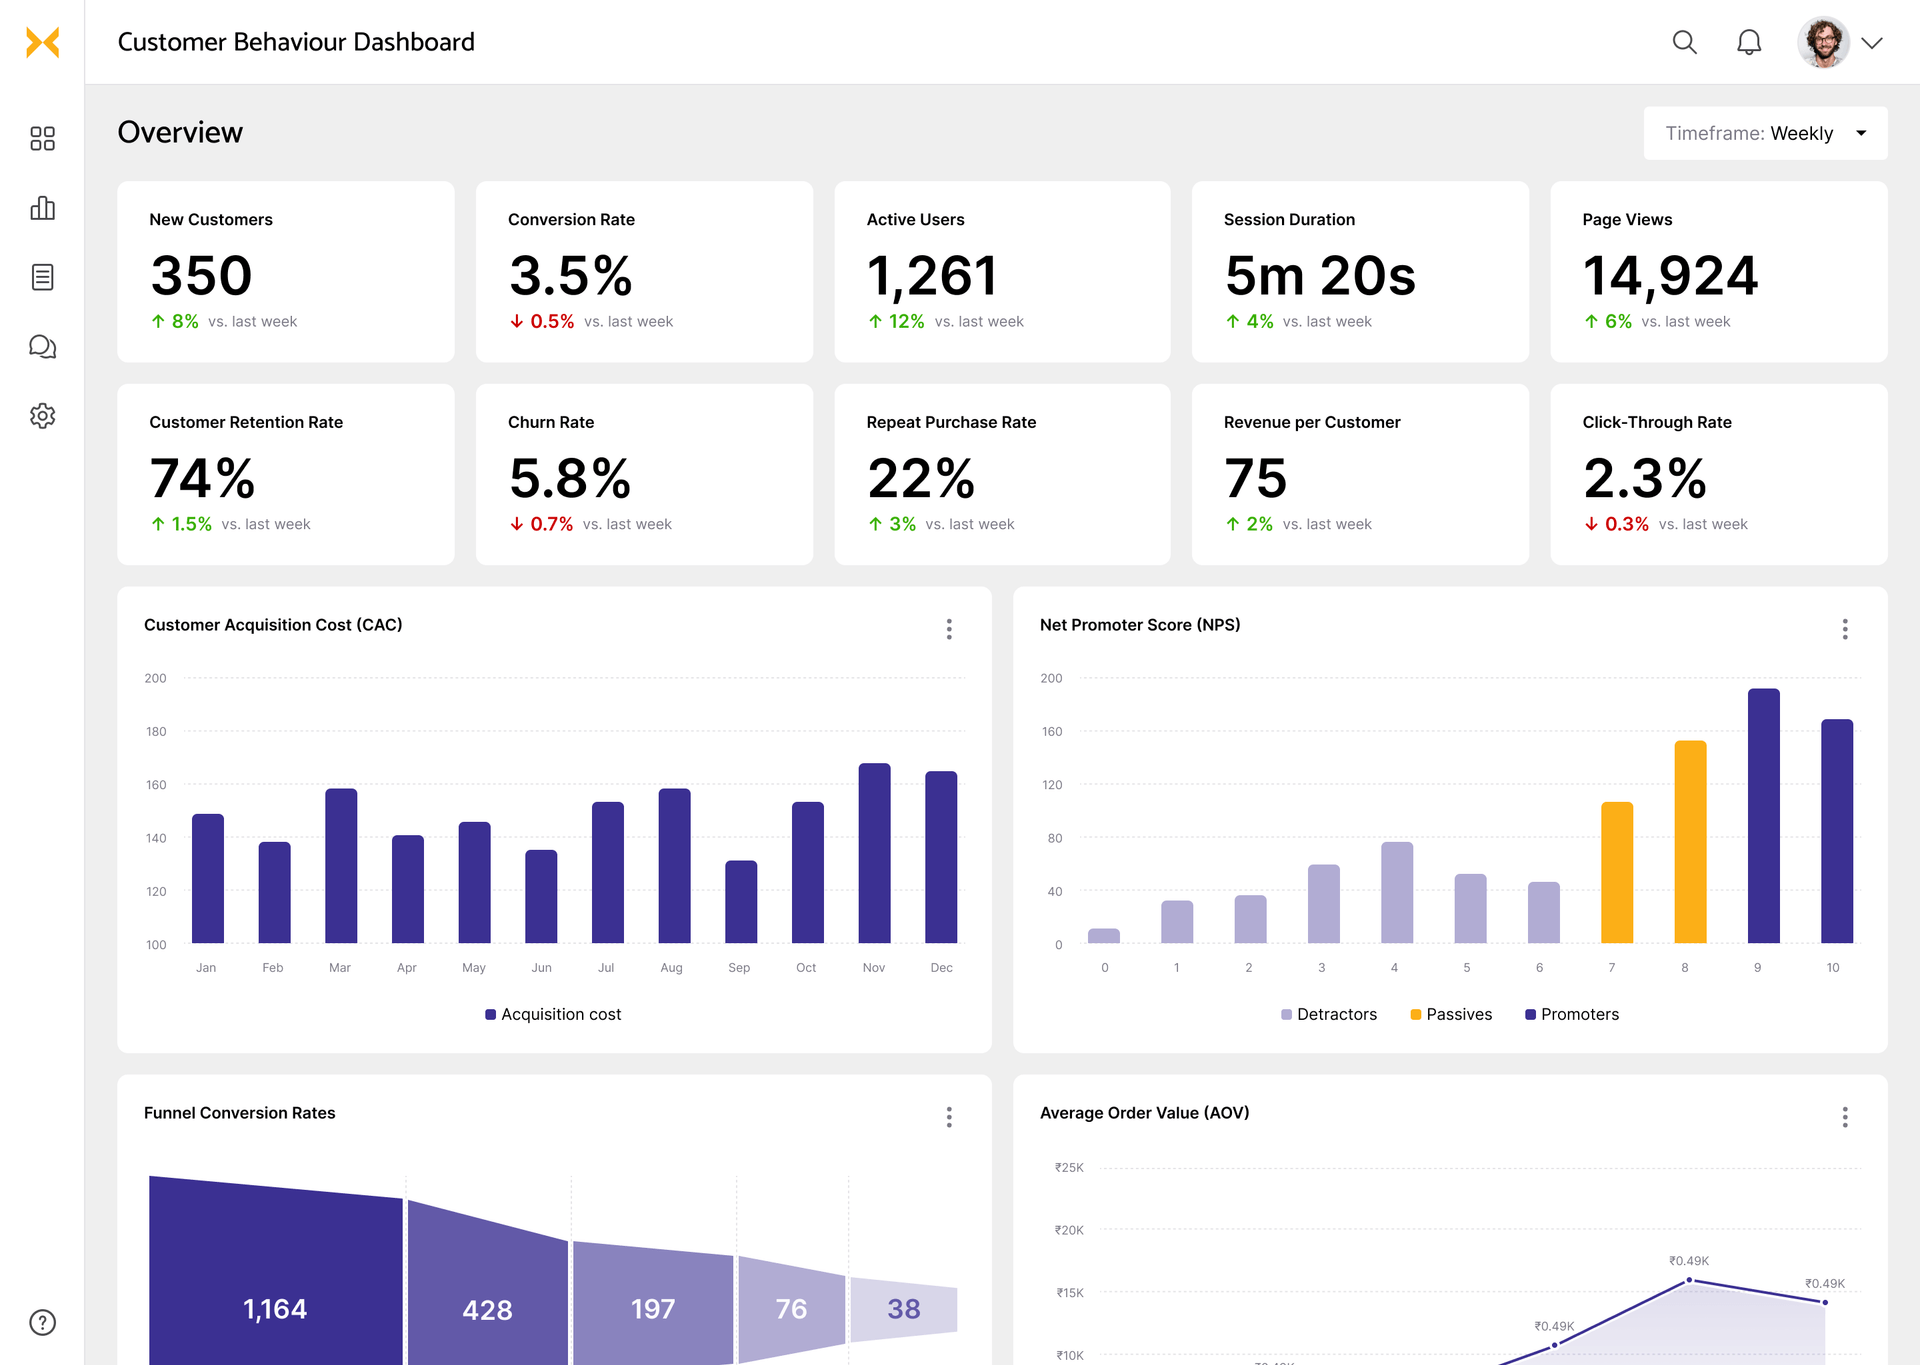
Customer behavior dashboard
Learn beyond customer spending & transactions. Spot and track customer behaviors, customer habits, repurchases, plans and upgrades, and their overall journey with you.
Why datakulture?
Why datakulture?
10+
Years of experience
50+
Projects delivered
20+
Certified data & BI consultants
96%
Satisfactory customers

Dashboard by roles
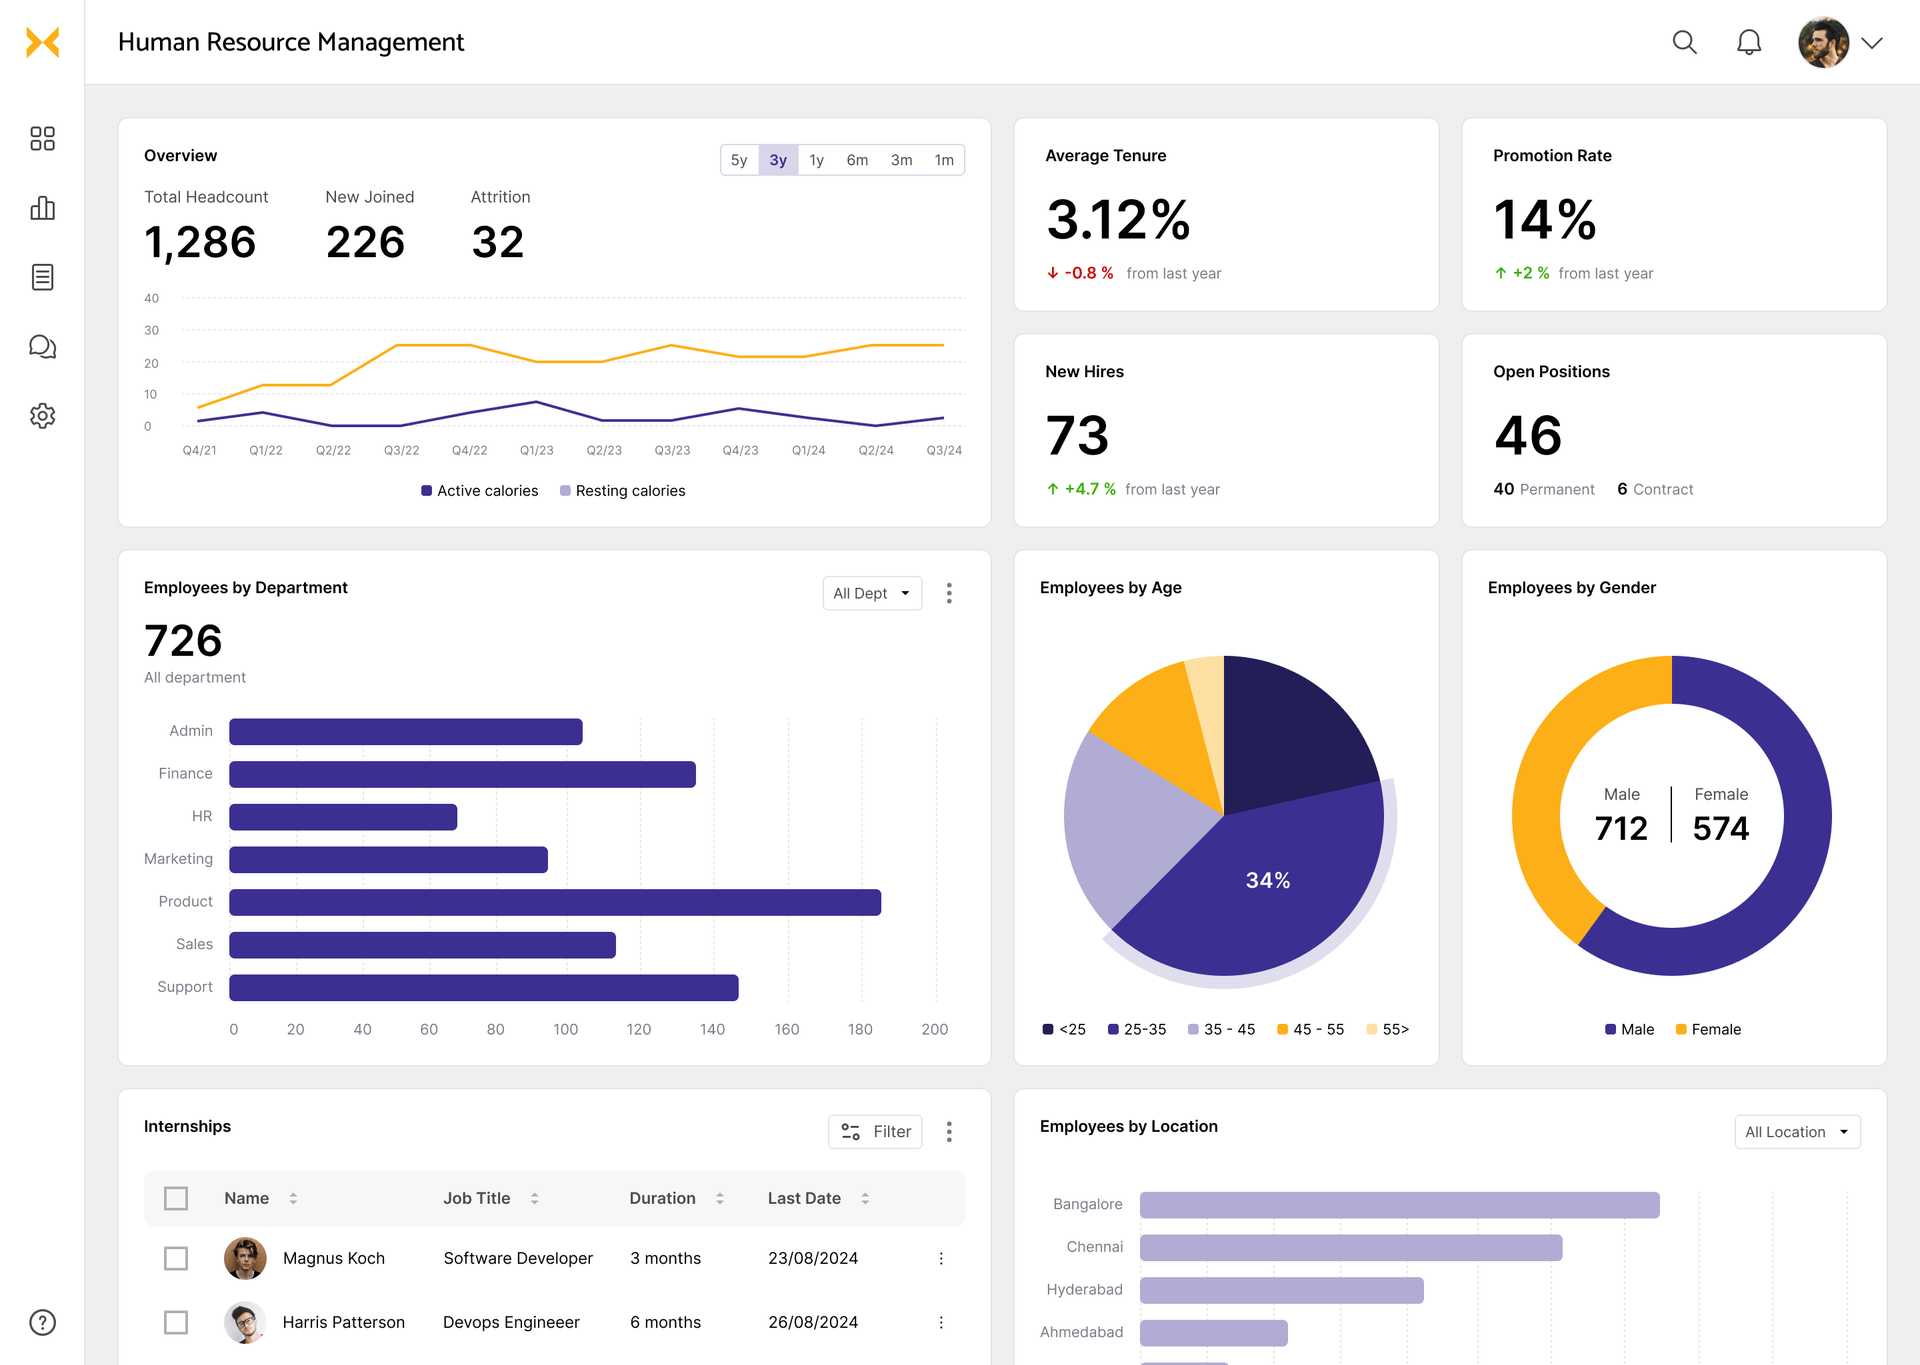
HR dashboard examples
Catch up on what’s happening in your company - from talent management to hiring to productivity
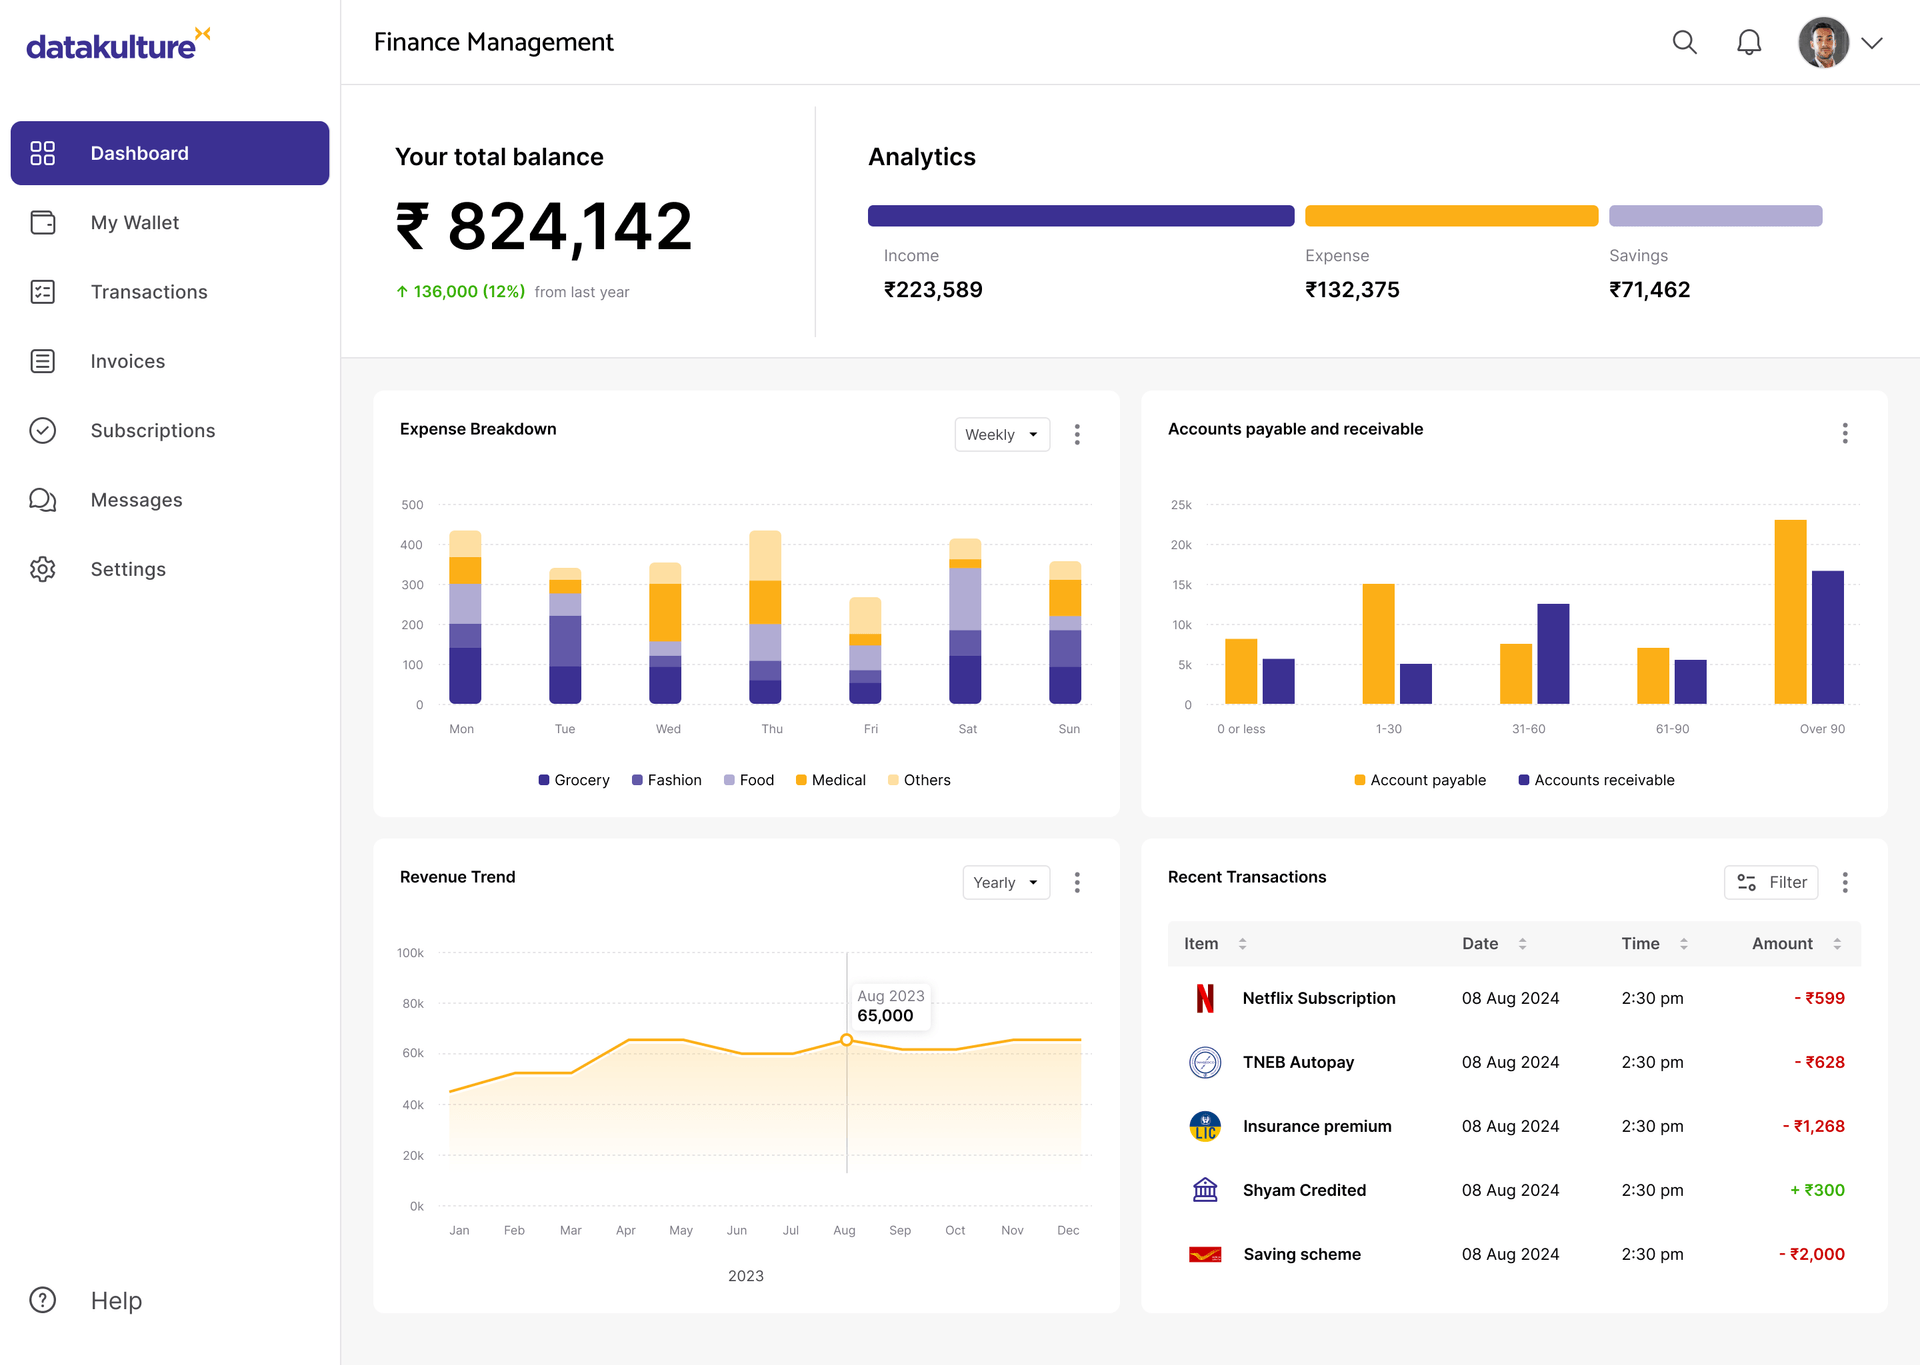
Finance dashboard examples
The window to your business wallet is here. Get a quick peek into your spending, income, top spends, etc., on a tap, visualized to your liking
Dashboard by industry
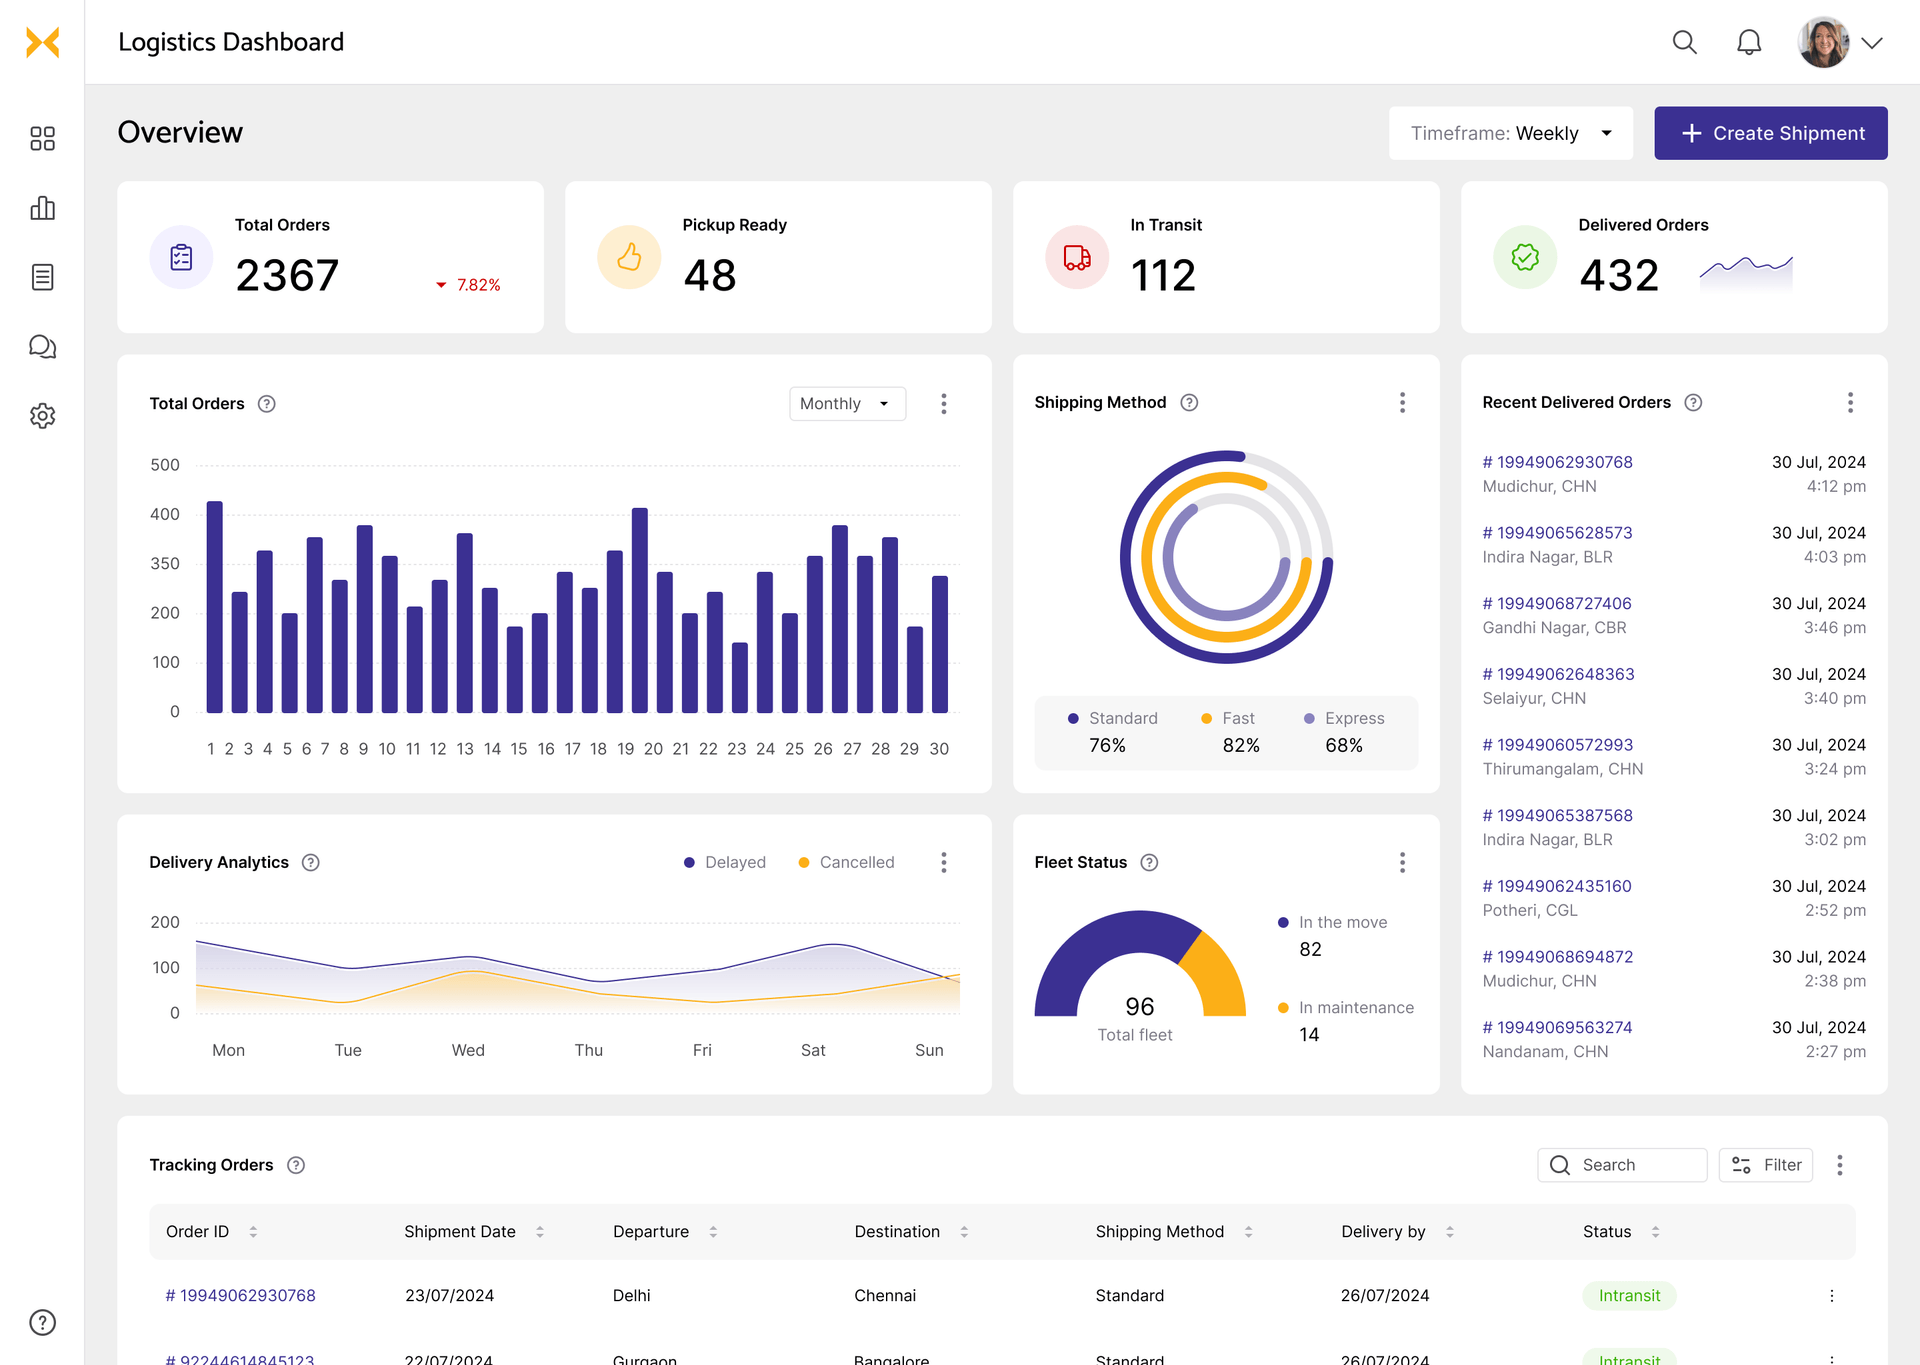
Logistics dashboard examples
Monitor your key KPIs in one place - from warehouse operations to transportation to supply chain management.
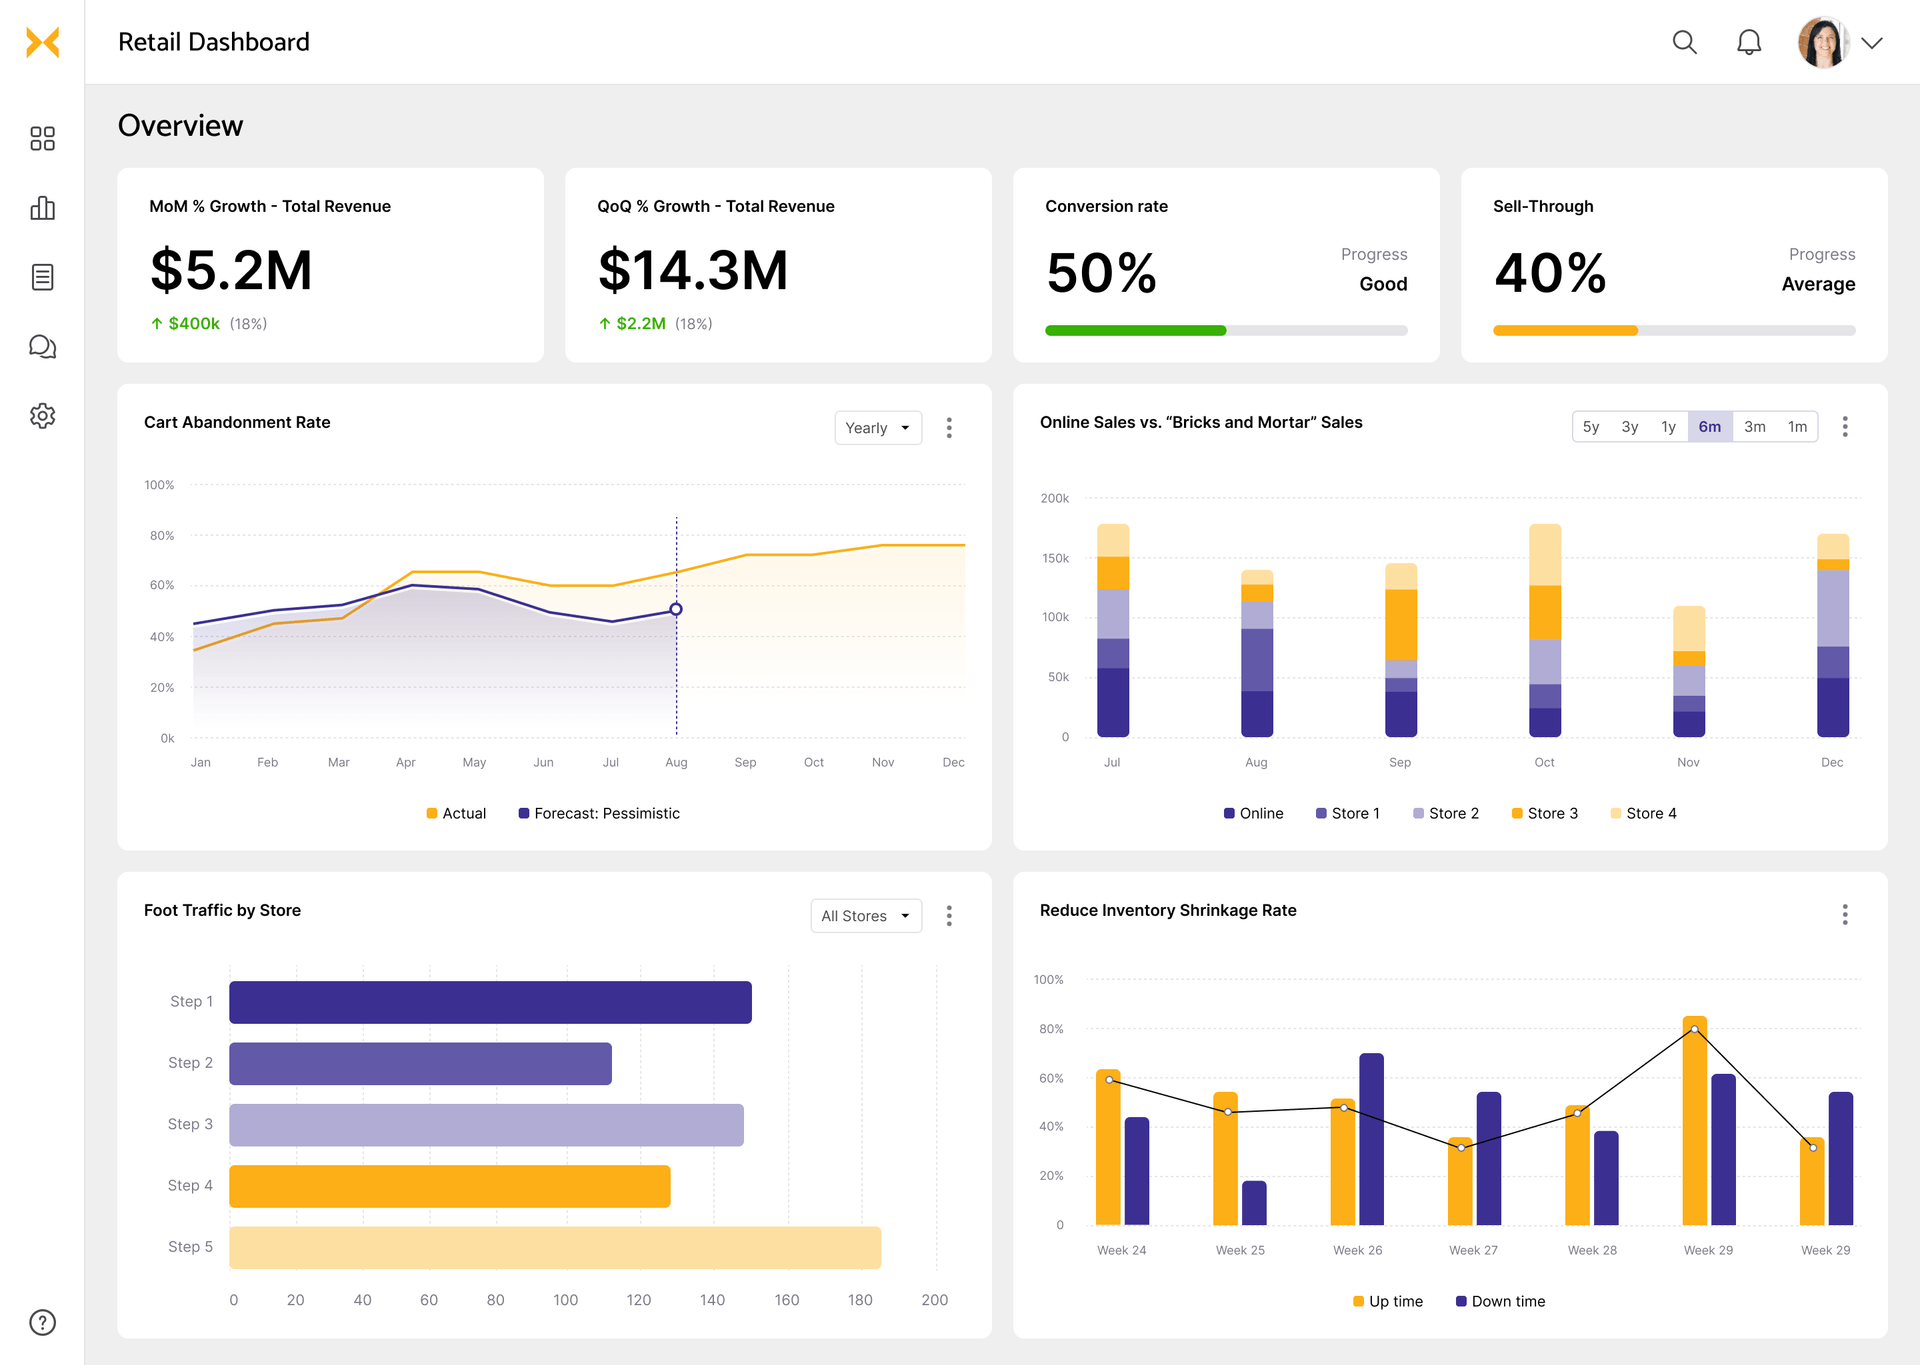
Retail dashboard examples
Monitor your key KPIs in one place - from warehouse stocks to sales to customer feedback