ML-powered lost sales analysis to uncover hidden revenue losses
Our senior data scientist explains strategies to uncover lost sales and unnoticed revenue losses with the help of machine learning, based on one of his previous projects. These techniques are effective and easy-to-be-implemented, especially for fast-growing retailers and eCommerce companies.

Thulasi
Sep 19, 2025 |
14 mins

What is lost sales?
Picture this: A customer walks into your store—or lands on your website—ready to buy a shirt they’ve already decided on. The intent is there, wallet in hand.
But then reality hits: their size is missing from the rack. Or worse, the system insists it’s “in stock,” yet the shelves (or warehouse) tell a different story.
Frustrated, they walk out—or close the tab—without buying a thing.
That’s not just a lost shirt sale. That’s a lost customer moment, and possibly a lost customer for good. This is a classic example for lost sales in retail and eCommerce – a loss of revenue you could have earned but didn’t because of inventory-related issues.
Lost sales is becoming a more common scenario in developing countries with omni-channel retail points—a shopper browses on website, spots a shirt they like, and checks “pick up in store.” The system confirms availability. They drive to the store—only to be told the item isn’t there. Wrong inventory sync. Wrong promise.
In short, lost sales = unmet demand due to operational, customer experience, or competitive gaps. For retail and eCommerce leaders, tracking and reducing lost sales is crucial to protect revenue and customer loyalty.
Lost sales is hard to detect. Here is why.
Most businesses can tell you exactly how much they sold last quarter. But ask them how much they could have sold if shelves were full, systems accurate, or stock replenished on time — and you’ll often get silence. That’s because lost sales leave no receipts, no transactions, no easy audit trail.
Here's why you can’t detect this quietly happening revenue loss in retail and eCommerce sales:
The system says stock is available, but shelves are empty.
No sales are recorded, so it looks like there’s no demand.
Replenishment arrives too late — and you miss the peak demand.
Did you know? Lost sales scenario is proven too—with staggering numbers. Studies show retailers lose anywhere from 4% to 8% of annual revenue to lost sales due to stockouts, delayed replenishments, or poor inventory visibility. In U.S. retail alone, that translates to over $1 trillion annually in missed sales opportunities.
So, how to detect lost sales then?
There are so many tools and quick fixes that promise you to detect and highlight and lost sales.
Sharing what worked for us with an eCommerce client with revenue around $8k million.
The goal - Detect, estimate, and reduce lost sales by building a smart, data-driven system...
What did the project involve? -> Sales forecasting and SKU prioritization using Pareto methods and Facebook Prophet.
What did the experiments lead to? -> Explorations on recurring concerns around stock-outs and zero sales.
Curious to know how our data science team dealt with this?
Three major ways inventory loss is happening and how to fix them
Phantom inventory: the ghost in the machine
Phantom inventory = when your system says you have 10 stocks, but it is not on shelf. Similarly, a customer sees a product being available for a particular size, but it’s not available in the dedicated warehouse or fulfilment centers.
Phantom inventory happens when the following happens:
1.Shrinkage (theft, damage, spoilage)
Items are lost but not updated in the system.
2.Scanning or data entry errors
Wrong barcode scanned, duplicate entries, missed returns, or mis-keyed quantities.
3.Process breakdowns
Items misplaced in the wrong aisle/bin.
Transfers between stores or warehouses not recorded.
4.System lags
Real-world movements (returns, sales, shipments) not synced quickly with digital systems.
Simplest way to detect and flag phantom inventory with a math formula:
Phantom inventory: Start inventory + new stock - sales – end inventory
Phantom inventory: Start inventory + new stock - sales – end inventory
Note: Flag for review, if the number reaches beyond the critical value. In our case, we set it up for 5x more than average daily sales.
Phantom inventory data analysis
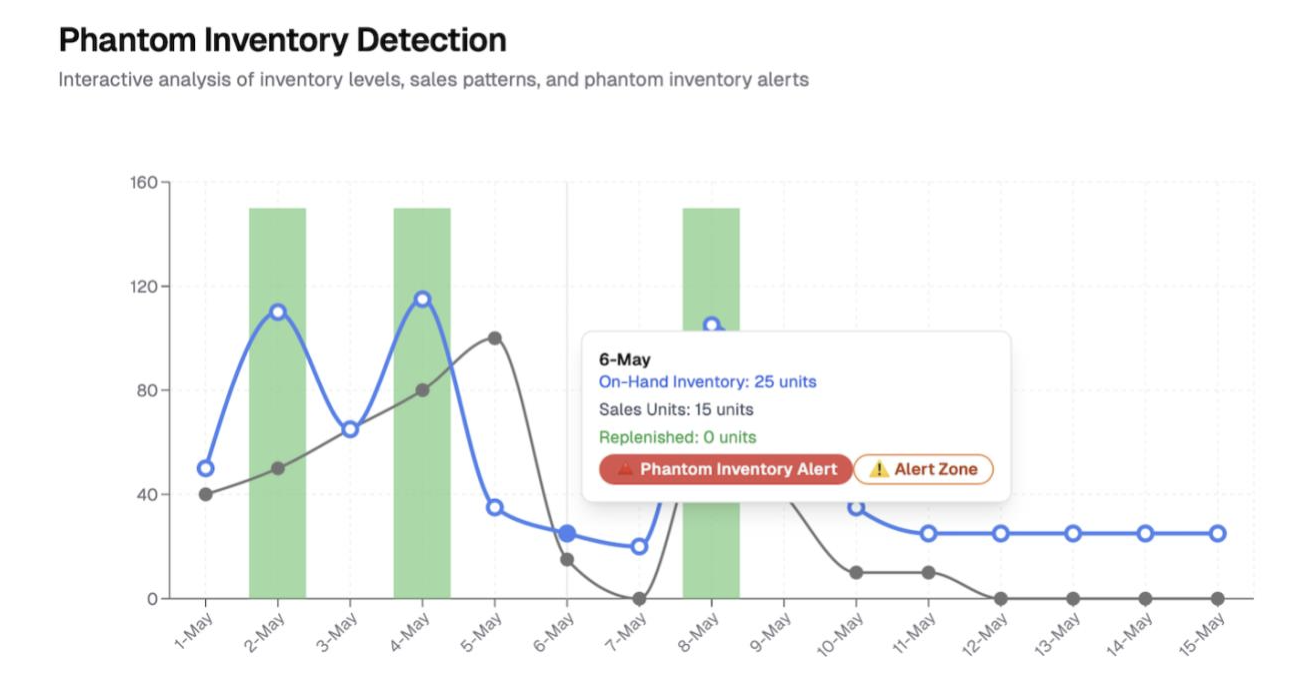
Here is a sample illustration. In this graph, look how inventory and sales move in tandem — when replenishment happens, both increases. Yet, around May 6, something strange happens: Instant sales drop that almost become zero while on-hand inventory still shows 25 units. Stock exists but fewer or no sales.
Other recommendations to solve phantom inventory
Methods | What it is and how it helps |
|---|---|
Real-time inventory visibility | IoT sensors, RFID tags, and automated shelf scanning (robots, cameras) detect actual stock vs. system stock. |
Data reconciliation dashboards | Compare POS, ERP, and warehouse data daily to flag mismatches. |
Predictive analytics | Spot unusual sales patterns (e.g., “stock hasn’t moved for 3 weeks” → possible phantom stock). |
Exception reporting | Alerts when a product shows system stock > 0 but no actual sales occur over a certain period. |
AI-driven audits | Machine learning highlights SKUs most prone to phantom issues (seasonal items, high-theft categories, frequently transferred goods). |
Out of stock and safety stock validations
Safety stock is like a buffer — extra inventory to protect against delays or spikes in demand. We focused on safety stock monitoring, which led to the following explorations:
Is the current stock less than safety stock? - That is, is the business about to hit zero before the next replenishment?
Is the incoming stock too little or too late? - Are there replenishment inefficiencies leading to missing the peak demand window.
When both are yes, then it is marked as a potential lost sale event.
Here’s a snapshot of safety stock monitoring and how it’s alerting on a potential stockout, when safety stock levels fall below the critical value.
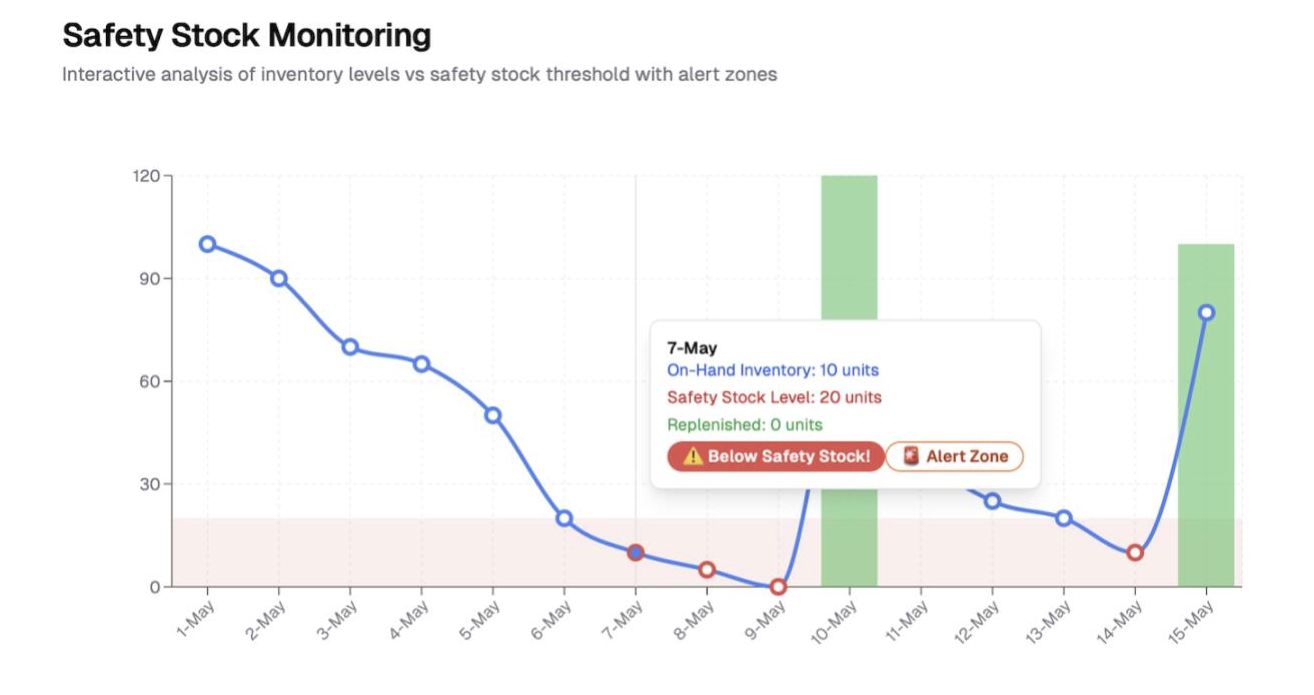
These safety buffer values can be adjusted based on real-time sales patterns, seasonality, and lead times too.
Identifying suspicious zero sales moments
Any SKU not selling for a day might be a temporary low demand. But consistent zero sales for prolonged periods when there will be mid to high demand?! That could be lost sales scenarios lurking in the background - phantom inventory, misplaced stock, or shelf gaps.
Here's how we identified the lost sales by estimating the probability of back-to-back zero sales days.
P(n-day zero sales)=[P(0 sales)]^n
P(0 sales on a given day) = Probability that demand exists but records 0.
For n consecutive days of zero sales (independent days assumption)
When the probability of sales is 10% or above, that means 10% or higher demand exists, but met with no sales. Why? Inventory issues, probably like:
Stocks hidden in the back room
Barcode not scanning
Customers not able to find the item on website or shelves.
So, one can conclude that the longer the streak of zero sales, the less likely it’s “normal.” At some point, it’s almost certainly a lost sales problem.
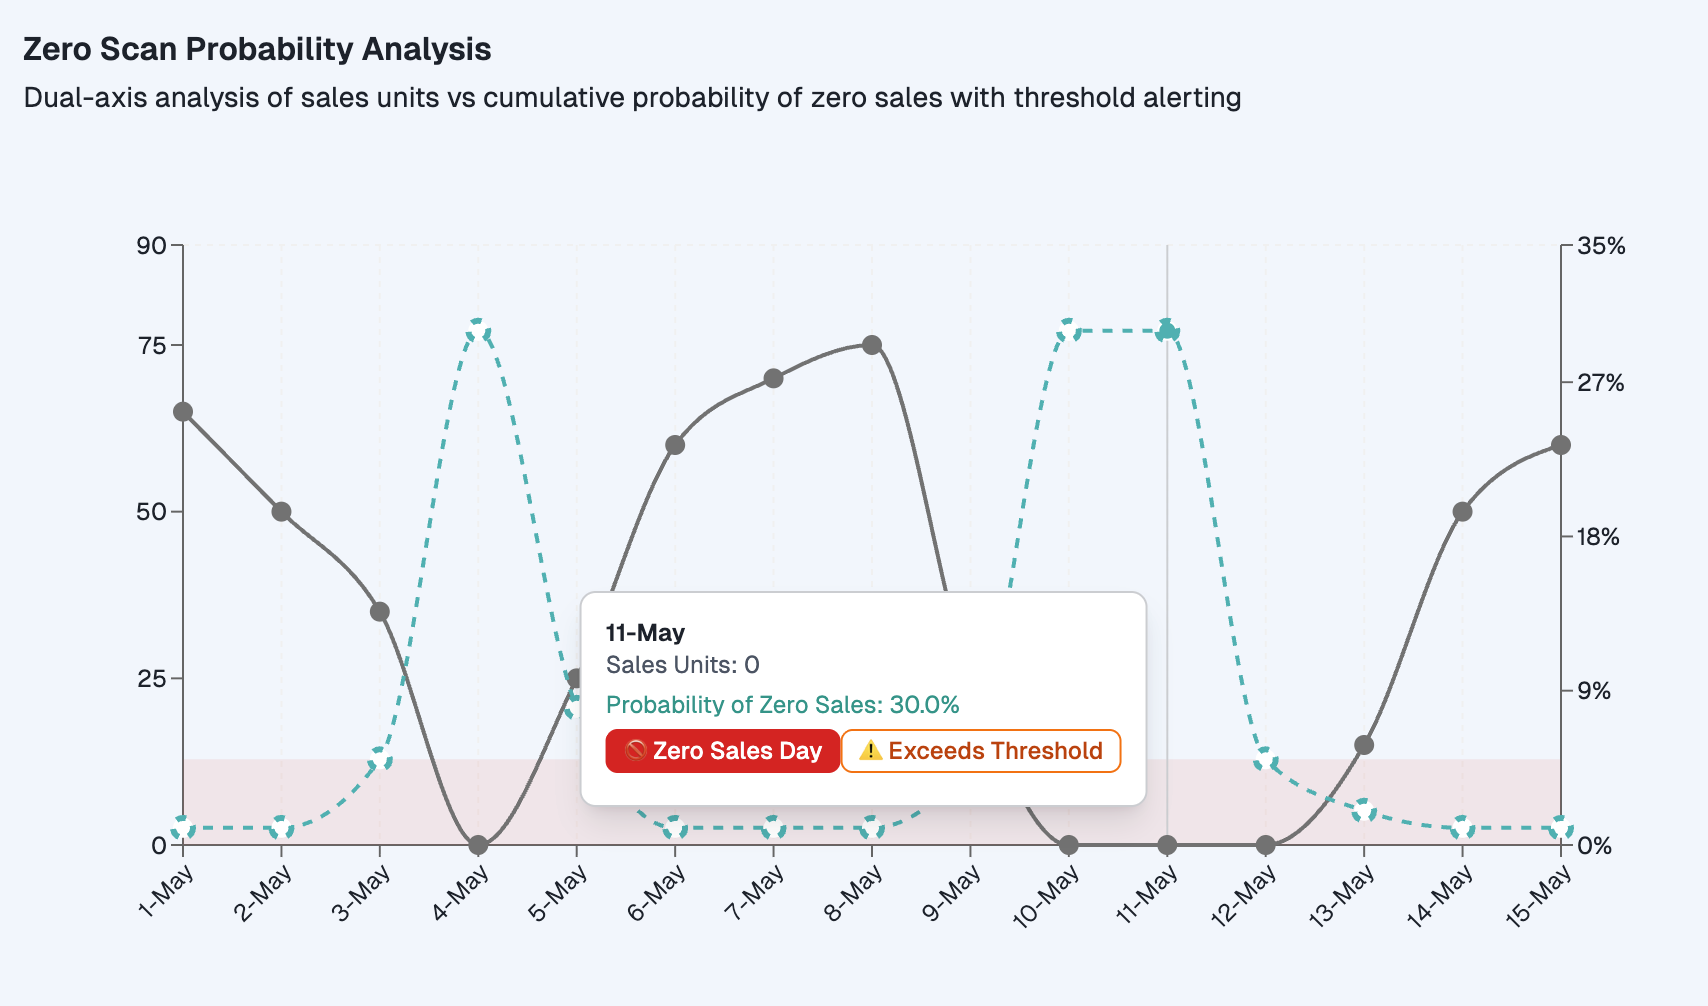
Look at the above chart, where you can find how the sale units were zero for consecutive days even when demand probability (100% - Probabilty of Zero sales is 70%) is present, raising further alerts so the team can look at it instantly.
How to measure lost sales accurately
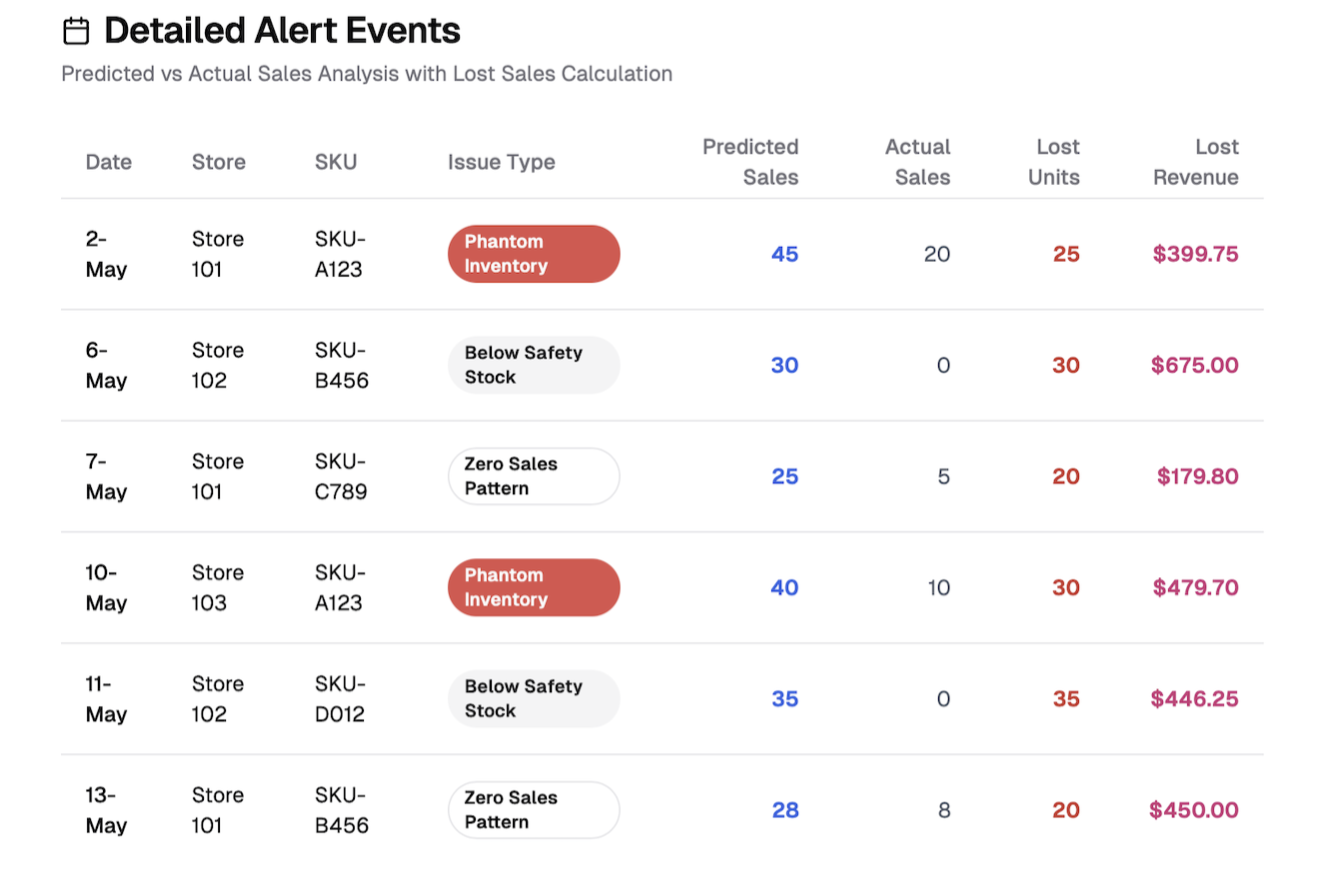
The above steps are to detect the lost sales events. Here's how you can measure them accurately once you sense its presence.
Data points required to measure lost sales
Predicted sales
Actual sales
Inventory status when lost sales occurs
The difference in the value is estimated to be lost sales estimate in revenue.
Other ways to measure lost sales with analytics, IoT, and AI
These are some other techniques retail and eCommerce businesses commonly use other than comparing sales vs demand.
Basket/cart abandonment analysis (eCommerce)
Look at how many customers add an item to cart but fail to buy due to stockouts, high delivery times, or checkout failures.
Cart abandonment tied to stock issues = clear lost sales.
Out-of-stock impact studies
Some retailers run OOS experiments:
When item X is in stock, average daily sales = 100.
When it’s out of stock, sales drop to 0.
That difference = true lost demand.
Customer behavior & loyalty data
Loyalty program or repeat-customer tracking show when customers stop buying a product altogether after stockouts.
Helps measure not just the immediate lost sale, but the lifetime value loss.
True demand isn’t always accurately observable. That’s why combining multiple techniques works -> forecasts, real-time availability, substitution data, and zero-sales probability checks.
Measuring lost sales with interactive tools
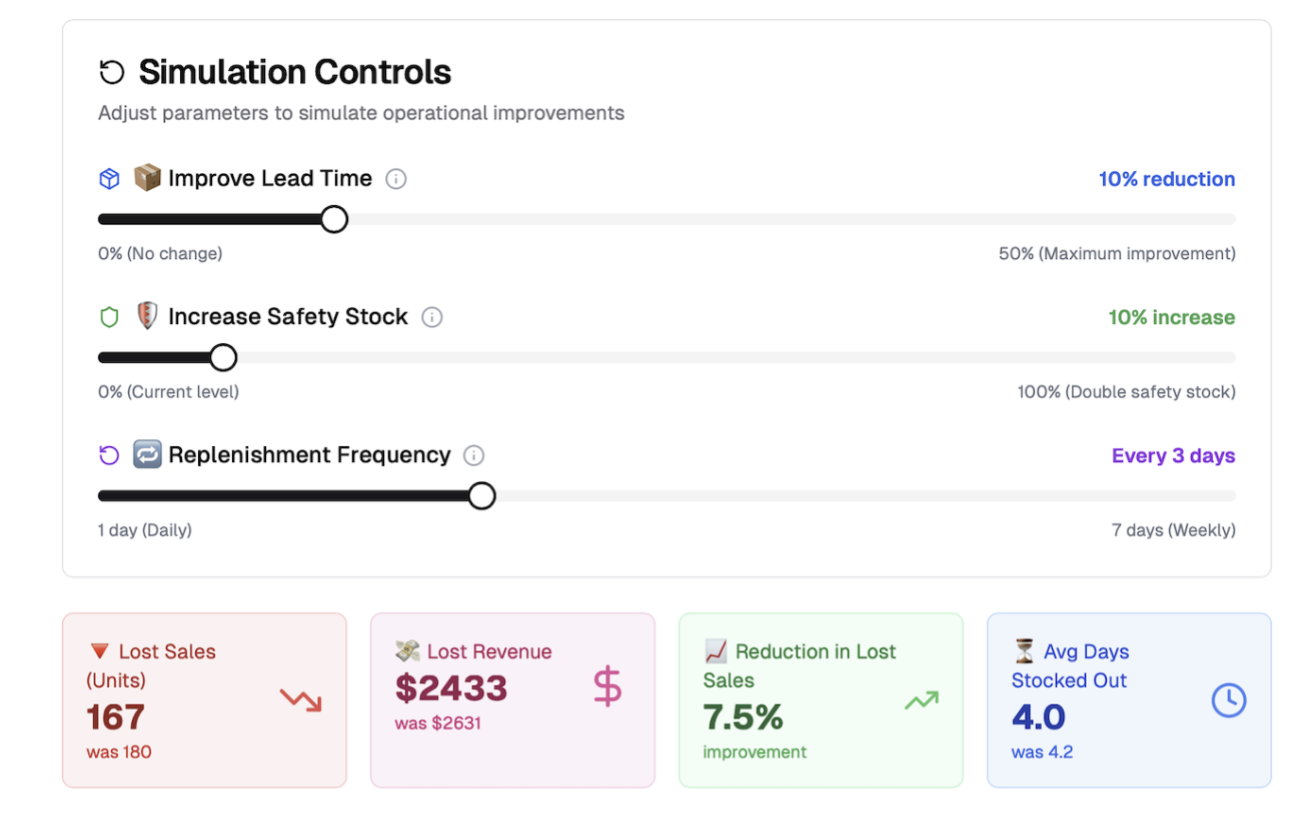
While it’s easier to measure to make this useful for business users, we built a dashboard that had the following options and features:
• Tabs for each issue (phantom inventory, stockouts, zero sales)
• Lost sales estimates/alerts by store and SKU
• “What If” sliders to test and find how lost sales estimate vary depending on other factors like:
– What happens if we improve lead time?
– Or increase safety stock?
– Or replenish more frequently?
From losing revenue to lost sales to becoming ‘inventory aware’
You never get a receipt for what didn’t sell, so most “loss” is never measured. A lost-sales tool surfaces those shadows. But fixing something that you didn’t even know is broken, that’s another level blindspot fixing.
It’s sad that retailers lose ~4% of annual sales from inventory inaccuracies alone. That’s why a lost sales detection solution is important today. With visual and interactive options, it’s easier to turn hidden demand into visible data – where customers tried to buy but couldn’t.
In a world where competition is one click away, the ability to capture every possible sale isn’t just operational efficiency — it’s survival. A tool like this doesn’t just plug revenue leaks; it builds trust, loyalty, and resilience in your business model.
