Building a robust campaign performance tracking solution for marketing
One of our data analysts shares their experience building a complex marketing analytics solution using Power BI and other data tools. With detailed step-by-step instructions, this article can guide you in visualizing data from multiple sources to build a consolidated marketing dashboard.

Gowtham
July 11, 2025 |
10 mins
Marketing teams are no longer gut driven. They want accurate insights to measure campaign success, then and there, so they can observe what works and what doesn’t. Our data team worked on one similar project, which involved consolidating campaign performance metrics from multiple sources into a unified dashboard. This blog talks about their experience in detail, and every challenge the team encountered while doing so, and how it’s solved.
Why marketing teams need campaign performance reports and dashboards?
Our marketing team was asked this question during one of the casual chats. They didn’t say anything. Just showed us their files named spreadsheet (1), spreadsheet (2), campaign FINAL.xlsx, and more like this.
“I spend more time aligning column and rows than aligning messaging. And by the time the report is “ready,” the buzz has already moved on.” This is the voice of every campaign management team. Not just this, there are many problems that marketing teams tackle, which can be answered by a performance tracking dashboard.
Too many channels. No clarity
The client we worked with alone had data coming in from multiple platforms: Google Ads, Meta, and GA. But there is no single view, which could help them find answers like:
What’s driving conversions?
Which audience is stalling?
How does the engagement trend traverse in a week? And the likelihood.
To make budget decisions based on data
Everyone who spends money in paid marketing campaigns know, how resource burning it is. Such tools require real-time monitoring so the spend can be controlled, otherwise the budget evaporates just like that before one can guess and act.
The reporting loop
Even with regular numbers and data, it’s still difficult to answer questions, keep everything in track, and send periodic reports to other involved teams. There are other challenges like versioning, converting data into graphs, fixing last week’s numbers, all while figuring out a way to cut through noise and align the team on metrics that matter.
On top of all these, there are marketing initiatives that don’t leave a UTM trail—which means it is immeasurable and doesn't have a tangible ROI. These are the reasons why businesses need marketing campaign performance solutions, a visual way to bring clarity through carefully deduced metrics and KPIs.
Building campaign performance dashboard using Power BI
Here’s our framework for near real-time insights and centralized reporting of marketing campaigns.
Collecting business requirements
The goal was to build a dynamic dashboard that would help business users monitor campaign KPIs store-wise (Over 600 stores) and month-wise, enabling smarter marketing decisions. But there is a catch. Power BI does not offer direct connectors for platforms like Google Ads or Meta (given the high data volume we had). Also, we wanted to limit the latency issues that might occur when a high-volume data source is directly connected to Power BI.
We needed a reliable and automated solution to fetch, store, and transform this data before presenting it using Power BI, which invited data engineering and processing requirements (explained later).
Identify what needs to be visualized
For a performance-driven marketing campaign, the major KPIs one needs to measure are as follows:
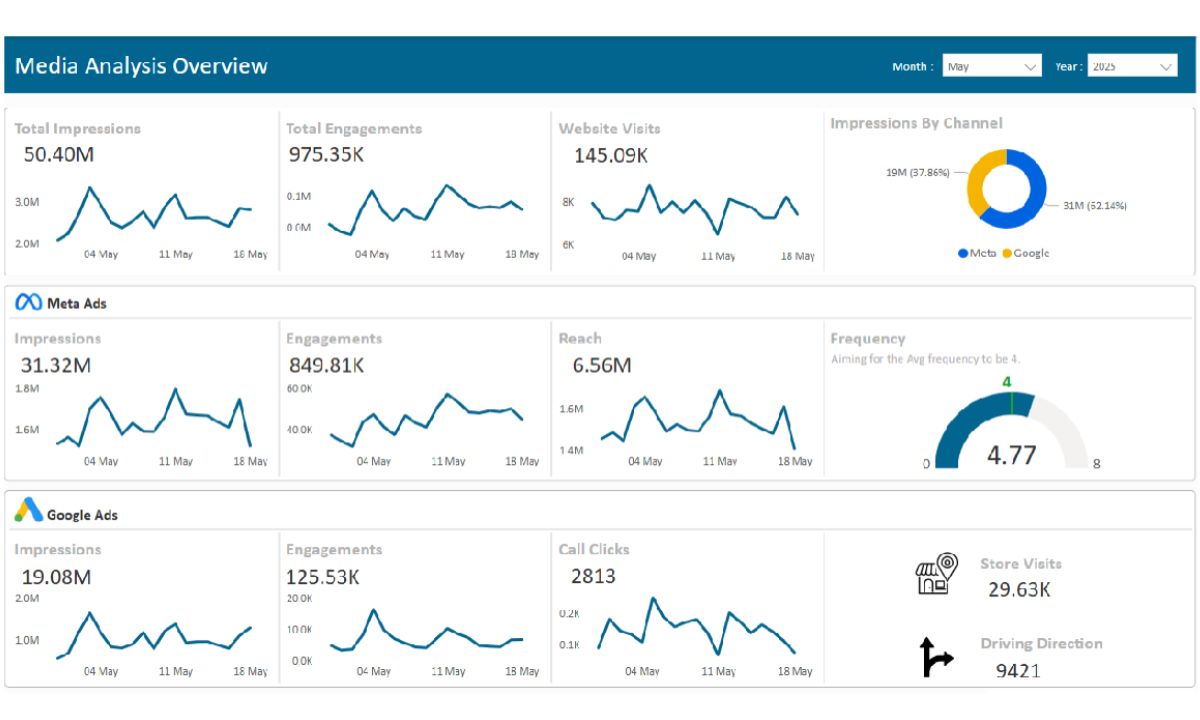
Total Impressions - The number of times the ad or content appears/shown to users, regardless of clicks or engagement.
Engagements – The action taken by users, clicks, likes, link sharing, and others.
Website Visits - The number of users who clicked through to your website from a campaign or platform.
Reach - The total number of unique users who saw your content or ad at least once.
Store-wise filtering - Ability to view campaign or sales data specific to individual store locations.
Promotional period selection (dynamic by campaign dates) - To filter data automatically based on the start and end dates of each campaign.
We have selected all the above KPIs while building the dashboard, so the user can see them together in one place.
While these KPIs were relevant for our performance marketing campaign, there are also other KPIs like: conversion rate, cost per acquisition, customer lifetime value, bounce rate, return on ad spend, new vs returning customers, and more.
Data processing
In our case, these are the primary data sources for the marketing campaigns.
Google Ads – GA Query Builder Reference Link
Meta Ads
Google Analytics
The team was already receiving vital metrics like impressions, engagements, reach, and website visits from the above platforms—but integrating them seamlessly required a custom data pipeline.
Since there is no direct data integration option available, we built custom Python scripts to do the following:
Integrated with the APIs of Google Ads, Meta, and Google Analytics 4 using Python.
Automated token refresh and data ingestion workflows.
Processed and organized data following the Medallion architecture (Bronze, Silver, Gold layers).
Connected PostgreSQL to Power BI using a structured model to efficiently manage and transform the data.
Visualize with Power BI or any BI tool
As the data is loaded into PostgreSQL, we designed, developed, and published dashboards in Power BI, which looked something like the below. The same data can be reflected in any visualization tool like Tableau, Qlik, etc. The dashboard became a one-stop-shop for their marketing, business operations, and management team to observe their campaign performance, spending, and ROI across tools.

Common challenges with marketing data aggregation and how to fix them
Here are some of the common challenges our team faced while dealing with marketing data and its processing.
1. Reach mismatch issue
The total number of reaches per day not counting up to the summary level reach. For example, you run a campaign, and the unique people reached is shown as 600 on day 1 and 800 on day 2. But there are always cases, where the same user has seen an ad multiple times; so adding them up simply means double-counting people.
Here’s how we solved the number mis-match issue in aggregation:
Instead of adding daily reach, the team pulled summary-level reach data directly from the platform Meta, which already calculates true unique reach over the entire campaign period. For this, create a separate Power BI query for summary reach and displayed it at the right level—ensuring accuracy and avoiding confusion.
2. Dynamic promotional periods
The start and end dates of campaigns vary heavily. Some started on June 1, others on June 15, some ended early, some ran longer. This means each store had its own custom promotional period. In such cases, generic filters may not work and might even mislead, not allowing you to compare two stores nor accurately measure campaign performance.
How to solve this issue: apply a special logic to automatically detect each store and its active campaign period. This improved dashboard’s effectiveness and accuracy, while creating personalized view for every store.
Other similar challenges one might encounter while building a marketing dashboard:
If you are aggregating data from Meta, Google analytics, and other performance data sources, you might observe the following challenges. We have also explained how to fix these in the next block.
Challenges | How to fix them? |
|---|---|
Every platform has unique metrics and definitions to measure them. For example, clicks and impressions on LinkedIn is calculated differently from the same on Google. | Use calculated fields or custom mappings to create standardized KPIs across platforms. |
If you are measuring data across different locations, time zone inconsistencies might be a hindrance, making the same event appear on two different days. | Standardize all timestamps during data preprocessing before visualization. |
The same sales data could be from two different campaign (email and Google or others), leading to duplicate data and unclear ROI measurement. | Set up more detailed logic – first click, last-click, where traffic derived from, and the like. |
Lags in data pulls in certain platforms, which affects real-time performance. | Enable retry API call mechanisms and use data quality and freshness indicators on dashboards. |
Benefits of campaign performance tracking dashboard
Unified visibility: No matter how many campaigns or how many categories are there, you can accurately view its performance data. In this particular marketing dashboard, we were able to visualize the data of over 600 stores.
Identification of under-performing campaigns: With clearly set up filters, it’s easier to compare two different or multiple products/attributes, finding out the low-performing ones easily.
Make data-driven decisions: With lots of impactful factors playing a role like budgets and ROI, making performance marketing data-driven is detrimental to growth. This way, every decision can be stemmed from real values and impact created before.
Final thoughts
Deep data analytics systems are highly helpful in many functional areas, not just marketing – something that not just displays numbers but communicates trench-level trends, making it more applicable to everyday decision-making.
Think of Netflix as an example for this—80% of Netflix’s watch activity on Netflix now comes from personalized recommendations. This shows how people trust data, not because they were presented with it, rather that it was the part of the system.
If you are looking to build such intuitive, layered, and multi-dimensional analytics solutions that people use and care about, then you are at the right destination. Meet datakulture and its team of experts (a blend of business and data enthusiasts). With our right mix of domain expertise and data proficiency, we can handle any kind of data complexity and challenge and build tailored BI products that drive real business value.

by Gowtham
Gowtham, our senior data analyst and Tableau specialist, knows how to tame messy data and turn it into interactive visualizations that don’t just look good, but stay reliable. A true data storyteller, he understands what every report should reflect and delivers insights that matter. Beyond analysis, Y also brings his creativity to marketing—contributing through writing, idea sharing, and video making.


